- A pocket-sized, annotated link-level map of the Internet, that can be represented in 7MB and updated daily with 1MB of data.
- Techniques to infer and concisely represent information stored in the forwarding tables of Internet routers, but in orders of magnitude lesser space.
- Implementation of iNano, a system that enables Internet-scale P2P applications to discover properties of Internet paths.
- Case studies using CDNs, VoIP, and detour routing to demonstrate the utility of iNano.
2 Motivation and Design Goals
2.1 Goals
iNano targets network applications that choose among multiple candidate paths to improve data transfer performance. The design goals of iNano and their motivations are as follows.
Rich path metrics: iNano should enable distributed applications to orchestrate their actions based on sophisticated path information. Application-perceived path performance may depend on one or more path metrics such as latency, loss rate, or bottleneck capacity. For example, TCP performance depends upon the latency as well as loss rate along the path, so a CDN re-director or BitTorrent tracker may wish to use both metrics in its decisions. A VoIP server such as in Skype may wish to pick a relay node according to the mean-opinion-score (MOS) metric [5] that depends upon loss rate and latency. Live video streaming systems [3,2,10] that set up an overlay network among participating end-hosts may wish to incorporate path metrics such as latency, loss rate, and bottleneck capacity in the construction of the overlay. A combination of these metrics determines the quality of the video a client receives as well as its initial buffering delay.
Scalable lookup: iNano should scale to every end-host in the Internet. The trend towards massively distributed applications such as CDNs, BitTorrent, and Skype suggests that the potential demand for path performance prediction requests may be comparable to DNS or web search. Given the frequent occurrence of detour routes [48,29], it is conceivable that every transfer is preceded by a query about alternative paths to the destination. Furthermore, the lookups must be local to be effective; otherwise, the delay incurred may outweigh the resultant improvement in data transfer performance.
Low infrastructure cost: iNano should incur a low infrastructure cost to set up and maintain. A server-based infrastructure will need to be continually provisioned as demand increases and will incur significant cost to deploy and maintain. Instead, iNano should leverage the property of P2P applications-users not only create demand but also contribute resources to the system-by using computing cycles and bandwidth on participating end-hosts rather than on dedicated servers.
Structural information: iNano should enable network applications to base their decisions on the structure of the path. For example, recent proposals have advocated locality-aware peer selection in peer-to-peer systems by either choosing paths that minimize the AS path length [9] or by jointly optimizing network cost and application performance [57]. Knowing the route can also enable applications to perform detour [48,7] or multipath routing [58,24] for reliability or performance objectives. Structural information can also be used to route around network failures [59,23].
Arbitrary end-hosts: iNano should enable an application to infer path information between an arbitrary pair of end-hosts, not just from itself to others. Many of the examples above involving redirection in peer-to-peer content distribution, VoIP relays, multicast overlay construction, and detour routing require this capability. Furthermore, iNano should provide forward as well as reverse path information between arbitrary end-hosts-a goal that is challenging even for paths originating locally because of the asymmetric nature of Internet routing.
2.2 Exploring design alternatives
| Design alternative | Rich path metrics | Structural information | Arbitrary end-hosts | Scalable | Infrastructure cost | |
| A1 | Network coordinates | × | × | × | ✓ | 0 |
| A2 | Information plane (e.g., iPlane) servers | ✓ | PoP path | ✓ | × | High |
| A3 | Information plane as "network newspaper" | ✓ | PoP path | ✓ | × | Low |
| A4 | Uncoordinated end-host measurements | ✓ | PoP path | × | × | Low |
| A5 | iNano | ✓ | PoP path | ✓ | ✓ | Low |
Why can't existing techniques achieve the above goals? To appreciate the challenge, let us consider a few natural design alternatives as shown in Table 1.
A1 is the well-studied network coordinates approach to infer latencies between end-hosts without on-demand measurement. In this approach, each end-host is assigned a coordinate, typically in a metric space, and the latency between two end-hosts is estimated as the distance between their coordinates. Distributed systems such as Vivaldi [13] implement the coordinate approach in a scalable manner. However, the only information they provide to an application running on an end-host is the latency on paths from that end-host to the rest of the Internet. Although the coordinate system could potentially be modified to predict latencies between arbitrary end-hosts by periodically disseminating a coordinate for every Internet prefix, it is unclear how to extend this approach to other path metrics such as loss rate or bottleneck capacity. Also, since coordinate systems rely only on end-to-end measurements, they do not provide information on the route traversed by a path.
A2 is an approach where applications issue queries about path performance to a network information service hosted on centralized or replicated query servers. This approach is suggested and made plausible by prior work, namely iPlane, that developed techniques to accurately predict the path and path metrics between an arbitrary pair of end-hosts. However, scaling replicated query servers to handle requests from all end-hosts-a workload comparable to DNS-is challenging and would incur a huge infrastructure cost to set up and maintain. The number of query servers provisioned will need to grow in proportion to the number of end-hosts issuing queries, making this approach impractical for typical P2P applications.
A3 replicates a query server on each end-host. This approach dubbed as "network newspaper" in [30] would disseminate an atlas of measured Internet paths to end-hosts to enable them to locally service their queries. The atlas can be refreshed daily by sending incremental updates; since most Internet paths do not change over a day [40], daily updates are expected to be small. Unfortunately, iPlane's atlas of paths is several gigabytes in size, making this approach unlikely to be adopted in practice. An alternative is to delegate this task to a local agent (like a local DNS nameserver) in each subnet, but the bootstrapping overhead would pose a barrier to widespread deployment and use. Another alternative is for each client to only download its "view" of the network, i.e., properties of paths originating at itself, but this approach does not allow an end-host to predict properties of paths between arbitrary end-hosts, e.g., as required to enable detour routing.
A4, where each end-host conducts its own measurements as needed, also suffers from the problem of not being able to predict properties of paths between arbitrary end-hosts. Furthermore, such uncoordinated measurements might impose an unreasonable measurement overhead, e.g., measurement of loss rates and bandwidth capacities require many large-sized packet probes to be sent into the network. A centralized coordinator and aggregator of measurements like iPlane amortizes this overhead, but makes dissemination a challenge as discussed in A2 and A3.
3 iNano Design
Our system, iNano, combines the best of the above alternatives. For scalability, iNano replicates query servers at each end-host. To predict rich path metrics, iNano uses a structural technique like iPlane that predicts the PoP-level 4 path between an arbitrary pair of end-hosts. However, the data required to make such predictions needs to be compact, like coordinates or like the AS-level Internet graph, unlike a huge atlas of measured paths.
The key insight in iNano is a novel model for predicting paths and their properties between arbitrary end-hosts using a compact Internet atlas. iPlane uses a path composition technique to perform path predictions. To predict the path from a source to a destination, the path composition technique composes two path segments that intersect with each other. The first segment is from a path out from the source to an arbitrary destination. The second segment is from a path measured from one of iPlane's vantage points to the destination's prefix. Depending on which intersecting pair of segments is chosen, the path obtained by composition is often similar to the actual route from source to destination.
Instead of using an atlas of measured paths like iPlane's, iNano uses an atlas of measured links. The space required by the former representation is proportional to the number of vantage points while the latter representation requires space linear in the number of nodes and edges in the underlying Internet graph. Consequently, iNano's atlas fits in less than 7MB, almost three orders of magnitude smaller than iPlane's atlas, enabling it to be distributed to lightly powered end-hosts. The key challenge in making this approach work is to make accurate predictions about Internet path performance from an atlas of observed links.
iNano's approach of distributing a compact atlas and locally resolving queries at end-hosts avoids significant investment in server infrastructure. The approach also offloads the bandwidth cost of disseminating the atlas and its periodic updates; the atlas can be swarmed among end-hosts using, for example, BitTorrent. The generation of the atlas itself is the only centralized component in iNano. A central coordinator distributes the task of issuing measurements to participating end-hosts and aggregates the measured paths into a set of measured links.
iNano's current measurement infrastructure is largely the same as that of iPlane [30] but processes the measurements in a completely different manner to make path performance predictions in keeping with the goals stated in Section 2. Although we use end-host measurements in building the atlas, we use as a starting point traceroutes from PlanetLab [41] to destinations in 140K prefixes, which include roughly 90% of prefixes at the Internet's edge. The interfaces discovered in the traceroutes are clustered together such that interfaces in the same Point of Presence (PoP) within an AS are in the same cluster; routers in the same PoP within an AS are similar from a routing perspective. To map the IP address of an interface to its corresponding AS, iNano uses the mapping from prefixes to their origin ASes as seen in BGP feeds [33] and also resolves aliases [53] to ensure different interfaces on the same router are mapped to the same AS. The clustering of interfaces in each AS into PoPs is performed using a combination of alias resolution, mapping DNS names to locations [55], and identifying colocated interfaces based on similarity in reverse path lengths.
iNano processes the gathered traceroutes in combination with the PoP clustering information to build an atlas of inter-cluster links. To annotate links in this atlas with performance metrics, iNano performs measurements to infer the latencies and loss rates of inter-cluster links. iNano uses the frontier search algorithm described in [30] to partition the set of links across the PlanetLab vantage points, with some redundancy to account for measurement noise. Each node then attempts to measure the latency and loss rates of links assigned to it. The technique for measuring loss rates is the same as that used by iPlane. Measuring latencies of links is hard due to the wide prevalence of asymmetric routing [40,21]. iNano tackles this challenge using a two-pronged approach-first, by identifying symmetric paths, and second, by leveraging measurements of symmetric paths to measure latencies of other links that do not appear on symmetric routes. iNano's link latency measurement techniques are described in [28]. To estimate the end-to-end latency and loss rate between a source and destination, iNano predicts the forward and reverse paths between these end-hosts and composes the properties of the inter-cluster links on the predicted paths.
4 Route Prediction
In this section, we develop an inference algorithm that predicts routes by composing observed links between routers. The set of observed links yields a graph capturing the Internet's physical topology. In order to predict an end-to-end route accurately, we need to compactly model the routing decisions made by routers along candidate paths in this graph.
This inference and modeling problem is not easy. Inferring routes would be easy using a naive model that explicitly stores the information contained in the forwarding tables of routers in the graph. However, that defeats our primary goal of predicting routes using a compact graph representation. Thus, the key challenge to developing a compact model is to understand and describe the procedure routers use to compute routes, i.e., to concisely describe how Internet routing works!
4.1 The Problem: Modeling Internet Routing
Compactly modeling Internet routing would be trivial if routers simply used shortest path routing. The weights used for shortest path computation could be inferred using existing approaches [31]. However, Internet route selection is driven by a number of factors such as routing policies driven by economic considerations, traffic engineering driven by load balancing goals, and performance considerations that can not be characterized as shortest path routing. Furthermore, end-to-end Internet routes are computed by a set of complex interacting protocols (such as BGP, OSPF, and RIP) rather than a single protocol.
Fortunately, we are aided by a large body of prior research on understanding and reverse-engineering the routing decision process, as well as the knowledge the research community has acquired on how Internet routing works in practice. These result in the following commonly accepted "textbook" principles about how Internet routing works.
- Policy preference: ASes use local preferences to select routes. Typically, an AS prefers routes through its customers over those through its peers, and either of those over routes through its providers 5. Further, ASes do not export all of their paths to their neighbors; for instance, ASes do not export paths through their peers to other peers/providers. Commonly used export policies and AS preferences are believed to result in valley-free Internet routes [19], in which any path that traverses a provider-to-customer edge or a peer-to-peer edge does not later traverse a customer-to-provider or peer-to-peer edge.
- Shortest AS path: After applying local preferences, if a router has multiple candidate paths that it prefers equally, the default is to select the route containing the fewest ASes. Typically, several paths may have the same local preference and AS path length.
- Exit policies: Among these, routes are chosen
so as to meet intradomain objectives, e.g. by choosing the nearest exit point to the next AS (referred to as early-exit or hot potato routing) along the path. In some cases that often involve explicit compensation or negotiation among adjacent ASes to reduce their combined costs, ASes adopt a late-exit policy.
How well does the above procedure describe Internet routing? To evaluate this, we develop a simple algorithm based on dynamic programming that underlies various forms of shortest path computation. The algorithm incorporates the above criteria to compute an on-demand route, based on a graph representation of the Internet.
Our first attempt, GRAPH, reduces the representation size by over two orders of magnitude, but has poor prediction accuracy. This suggests that exceptions to the above criteria are common and must be carefully integrated into the model, as we describe in Sections 4.3.1-4.3.4.
4.2 GRAPH: A first cut
We present the algorithm in three steps. First, we describe a basic algorithm using dynamic programming (similar to Dijkstra's shortest path algorithm) that captures the preference for short AS paths, assuming early-exit between every pair of ASes. Second, we augment the algorithm to model late-exit when necessary. Third, we augment the algorithm to model common export policies and local preferences for routes.
|
4.2.1 Basic algorithm
Figure 1 shows the pseudocode for GRAPH, an algorithm that predicts the route between a source s and a destination d. It chooses the shortest AS path among all valley-free paths between s and d; further, it uses early-exit at every AS. The algorithm is similar to Dijkstra's shortest path algorithm. Unlike conventional Dijkstra however, the route computation 1) backtracks from the destination to all sources, and 2) uses a two-tuple cost metric.
The cost of a route from each node v to the destination d, represented as D(v,d), is a strictly ordered two-tuple [number of AS hops to the destination, cost to exit the current AS], with the first component considered as the more significant value. For two adjacent nodes v and w connected by a link of latency l(v,w), the cost of the edge between them, represented as c(v,w), is defined as [0,l(v,w)] if v and w are in the same AS, and as [1,0] otherwise. The &oplus operator in the algorithm resets the second component to 0 upon crossing an AS boundary as follows. If v and w belong to the same AS, D(w,d) &oplus c(v,w) is defined as D(w,d) + [0,l(v,w)], where `+' does the usual component-wise addition. If v and w belong to adjacent ASes, D(w,d) &oplus c(v,w) is defined as [D(w,d)[1]+1, 0]. It is straightforward to verify that this definition of cost preserves the invariant that if a node u &isin N', then P(u,d) is a shortest path from u to d. As in Dijkstra's algorithm, this invariant ensures the correctness of the algorithm.
4.2.2 Incorporating late-exit
It is straightforward to extend the above algorithm to handle pairs of ASes that use late-exit instead of early-exit. We model late-exit as two adjacent ASes v,w (such as AS6380 and AS6389 - both of which are owned by Bell South) jointly computing the path through them in order to minimize the overall transit latency. To infer late exit, we use the technique proposed in [54]. We simply redefine the � operator in the following way. An inter-AS edge (v,w) corresponding to a late-exit route has c(v,w) = [0,l(v,w)], meaning that it is treated as an intra-AS edge. We do however have to increment the AS hop count by two when we backtrack out of the AS containing v. This is accomplished by maintaining another component in the cost tuple that corresponds to the number of consecutive late-exit transitions. This component corresponds to the number of AS hops that are not yet accounted for in the AS path length component of the cost metric. Whenever an AS transition is traversed where late exit is not applied, this third component is added into the AS path length component and reset to zero.
4.2.3 Incorporating export policies
Next, we incorporate constraints corresponding to commonly used export policies. We infer AS relationships, such as which are peers and which have paid customer/provider transit , using a combination of CAIDA's inferences [16] and Gao's technique [19]. We model the default export policy in which an AS advertises any paths through customer ASes to all its neighbors, and it exports paths from peers and providers to only its customers. It is well-known that this export policy leads to valley-free routes.
To compute valley-free routes, instead of having a single node for each cluster (PoP) i, we instead introduce two nodes in the graph: an up node upi and a down node downi, and GRAPH computes the path from ups to downd. The idea is that the construction of edges will force every path to transition from up nodes to down nodes at most once, thereby guaranteeing the path is valley-free. Let i and j be two clusters observed as adjacent.
- If i and j belong to the same AS, there is an undirected edge between upi and upj and one between downi and downj.
- If i's AS is a provider of j's AS, there is a directed edge from upj to upi and another directed edge from downi to downj. This edges capture that a customer will not provide transit between two providers.
- If i and j belong to peer ASes, there is a
directed edge from upi to downj and from
upj to downi. These edges capture that i's AS will
use paths through j only for itself and its customers (and similarly for
j's AS and paths through i).
Finally, for each IP address i, there is a directed edge from upi to downi. It is easy to verify that all routes in the graph are valley-free by construction (after transitioning from up to down, a transition from down to up can no longer occur).
 |
4.2.4 Incorporating local preferences
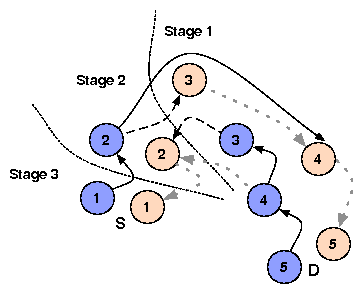
Next, we incorporate local preferences in selecting AS paths. We assume that an AS prefers paths through its customers over those through its peers, which are in turn preferable to paths through provider ASes. To incorporate these preferences, instead of calculating paths to the destination from all ASes and all routers in a batch, GRAPH computes routes in three phases.Figure 2 illustrates the phased approach. GRAPH first limits the graph to contain only the set of down nodes, along with the edges connecting them, and computes the optimal paths from these nodes to the destination. This frontier reaches precisely the routers in those ASes that get paid for providing transit to the destination. Once all such nodes have been visited and their best paths discovered, the algorithm is allowed to reach any additional nodes that can be reached only using peering; by construction, only one peering is traversed. Finally, the algorithm is allowed to use any link (e.g., provider links) to reach all remaining addresses.
Results preview: As we show in detail in Section 6, GRAPH---despite taking into account many aspects of default routing behavior---correctly predicts only 30% of the AS paths for our measured dataset. In contrast, the path composition approach [30] (that dominates our achievable accuracy) achieves 70% accuracy using the entire set of observed routes.
On the other hand, the storage overhead of GRAPH is directly proportional to the number of observed Internet links. As we will see in the evaluation section, this is two orders of magnitude more compact than the path composition approach. Thus, the challenge is to improve GRAPH's accuracy while keeping it compact.
4.3 Addressing sources of prediction error
A careful examination of the above results reveals that GRAPH's inaccuracies arise partly from our failure to model certain other aspects of Internet routing behavior and partly from errors in inferred AS relationships. GRAPH's deficiencies are due to the following reasons.
- Asymmetry: A significant fraction of Internet routes are asymmetric [40,21]. While GRAPH reflects some asymmetry, e.g., due to early exit routing, it does not fully capture asymmetric policy behavior.
- Inaccurate export policy: If GRAPH fails to identify a peer-to-peer relationship between two ASes, it is overly lenient in inferring export policy and predicts non-existent routes that would be filtered in practice.
- Incorrect local preferences: An AS's customer may be a provider for specific paths. For example, two ASes may have different relationships in different regions because one AS may have larger network presence than the other in one region and vice-versa in another region. Incorrect local preferences could result in an AS selecting a less preferable route, e.g., via a customer.
- Traffic engineering: ASes may engineer routes in order to improve routing for their customer traffic compared to transit traffic.
We address each of these challenges by adding information in our data set back into the graph.
4.3.1 Addressing asymmetry
Due to the asymmetric nature of Internet routing, adding routes originating from the source to the atlas significantly improves the accuracy of predicted routes [29]. To reduce the likelihood of predicting non-existent routes, iNano splits the graph into two subgraphs: 1) TO_DST that consists of all directed links observed on the traceroutes from iNano's vantage points to all prefixes, and 2) FROM_SRC that consists of all directed links on the traceroutes contributed to iNano by participating end-host sources.
For each cluster, we introduce a directed edge from its corresponding node in FROM_SRC to its corresponding node in TO_DST. iNano then predicts the route using the Dijkstra-style algorithm that backtracks from the down node corresponding to the destination in TO_DST to the up node corresponding to the source in FROM_SRC. If it fails to find such a route, a likely scenario if the atlas lacks sufficient paths from the source prefix, then it attempts to find a path from the down node corresponding to the destination in TO_DST to the up node corresponding to the source in TO_DST.
4.3.2 Inferring export policies
GRAPH predicts non-existent routes that would be filtered given accurate AS relationships. Recall that we inferred the AS relationships automatically by analyzing observed behavior. Now, instead of explicitly distilling the AS relationships from the observed routes, we explore an alternate strategy that trades off a small amount of space for improved prediction accuracy. We seed iNano with known templates of export policy, e.g., if we observe a path that traverses the ASes Cogent, AT&T, and Sprint, we know that AT&T exports paths from Sprint to Cogent.
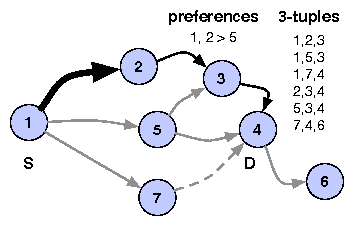 |
To implement this strategy, the valley-free check in GRAPH is replaced with the following 3-tuple check. iNano explicitly stores the list of all 3-tuples corresponding to three consecutive ASes observed in traceroutes as well as BGP feeds (discounting prepending). Ideally, we would consider a predicted route valid only if all constituent segments of size three satisfy the 3-tuple check by appearing in the list, meaning that the path was exported at every intermediate AS. In Figure 3, we see that, even though it is shorter, iNano cannot choose path 1-5-4 because the 3-tuple (1,5,4) does not appear in any BGP advertisement or traceroute. iNano easily incorporates the check in the backtracking step of the algorithm. However, since visibility into ASes at the edge is limited, we might fail to observe all of the export policies for the edge ASes. iNano thus performs this check only for 3-segments in which the degree of the middle AS in the Internet's AS-level graph is greater than a threshold (5 in the current implementation). Finally, we assume commutativity among triples, so that if we observe (AS1, AS2, AS3), we include (AS3, AS2, AS1) as well.
4.3.3 Improving local preferences
Recall that we infer AS relationships and incorporate the customer < peer < provider preference order in the route prediction algorithm. Unfortunately, AS relation inference by itself is difficult and error-prone. For example, AS relationship inference based on Gao's algorithm [19] predicts that half of the edges observed between the top hundred ASes ranked by degree correspond to sibling relationships, which seems rather implausible. The 3-tuple check by itself is not sufficient; although it ensures that predicted routes consist only of observed tuples, it does not take AS preferences into account when multiple options are available.
iNano uses a relationship-agnostic method to infer AS preferences based only on observed routes. We infer these preferences using the entire set of observed paths, but include only the results of the inferences within the compressed link-level representation of the atlas. The technique works as follows. For each observed AS route r, let r1,...,rm be the set of alternative routes available from the source, visible in the topology but not taken. For each route ri, if r and ri share the first k ASes but differ at the (k+1)'th AS, then the k'th AS is said to prefer the (k+1)'th AS on r over the (k+1)'th AS on ri. Each alternative route in the set r1,...,rm similarly yields a preference.
iNano stores the preferences obtained above as 3-tuples (AS1, AS2 > AS3), where AS1 prefers a route through AS2 over a route through AS3 when both routes are of the same length. In Figure 3, iNano selects the path 1-2-3-4 over the path 1-5-3-4 because of a preference (1, 2 > 5). In some cases, we observe both 3-tuples (AS1, AS2 > AS3) and (AS1, AS3 > AS2). So, we include the preference (AS1, AS2 > AS3) only if it was observed at least three times as often as the preference (AS1, AS3 > AS2). If not, we ignore both preferences; we conjecture that such wavering preferences are likely due to load balancing by AS1. While some AS preferences might be restricted to paths from specific source prefixes or to specific destination prefixes, iNano's model of Internet routing currently captures only preferences valid across sources and destinations. However, as we show in our evaluation, this suffices to significantly improve prediction accuracy.
4.3.4 Incorporating traffic engineering
In many cases, we observe an edge from AS1 to AS2 on some route in the atlas, but never see this edge on a route terminating at AS2, i.e., when the destination is in AS2. This occurs when an AS provides transit using one policy but routes to its own prefixes using a different policy, e.g., AS2 provides transit from AS1 to other ASes but does not send out BGP updates to AS1 for its own prefixes. The optimizations described above, the 3-tuple check and AS preferences, are insufficient to handle such cases.
To address the problem, iNano explicitly maintains information about provider ASes. For each AS, we determine its upstream neighbor ASes, i.e., the set of ASes observed immediately prior to this AS in the atlas. We also determine the set of providers for each AS, i.e., the set of ASes observed upstream of this AS when it is the origin. For the latter, we use both our traceroute data as well as BGP snapshots [33,47]. For 1,352 ASes out of a total of 27,515 ASes in the atlas, we find the set of providers to be a proper subset of the set of upstream neighbors. In such cases, the previous algorithms could give the wrong path. We refine the approach further to determine the provider and upstream neighbor sets on a per-prefix basis. In Figure 3, iNano cannot select the path 1-7-4, even though it is shorter, because 7 is not a provider for 4.
5 Implementation of iNano
Our implementation of iNano can roughly be divided into two logical components-server-side and client-side. The primary function of the server-side implementation is to gather measurements and to build the link-based atlas as described in the previous section. In addition, the iNano server bootstraps the distribution of the atlas to end-hosts.
The client-side implementation comprises a library providing information about Internet paths. The library performs four functions-fetching the atlas, augmenting the atlas with local measurements, servicing queries for path information from applications, and keeping the atlas up-to-date.
Fetching the Atlas: On startup, the iNano library fetches the atlas required for making predictions. The atlas fetched includes the following datasets: the set of inter-cluster links annotated with latencies and loss rates, data to map IP addresses to prefixes and ASes, AS degrees, AS 3-tuples, AS preferences, and the set of providers for each AS. Having all end-hosts fetch the atlas from iNano's server would require an extremely large amount of bandwidth to be provisioned at the server. This would significantly drive up the cost required to run and maintain iNano.
Therefore, we instead rely on swarming the atlas across clients in order to distribute it. iNano's central server serves as the seed for the dissemination of the atlas. In addition, every end-host running the iNano library makes available the portion of the atlas it has downloaded for other end-hosts to download. We have made our implementation sufficiently modular that any peer-to-peer filesharing protocol can be plugged in for distribution of the atlas. Our current implementation uses CoBlitz [39] and we are working on a version that uses BitTorrent [11].
Client-side Measurements: As previously explained in Section 4.3.1, iNano explicitly incorporates path asymmetry into its prediction model to improve the accuracy of path prediction. To enable this, iNano's library includes a measurement toolkit used to gather measurements of the Internet from the perspective of end-hosts. The library uses this toolkit to issue traceroutes daily to destinations in a few hundred prefixes, chosen at random from all the routable prefixes in the Internet. The new links discovered as part of these traceroutes are added to the FROM_SRC plane of the atlas. The library also uploads the measured traceroutes to the central server. The server incorporates these measurements into the atlas distributed out to all end-hosts. Buggy or malicious clients could distort the atlas by contributing incorrect or fabricated measurements. While such discrepancies could be inferred by comparing with measurements from other clients, we leave such inference to future work.
Serving Queries: Once the atlas is fetched and augmented with client-side measurements, the library starts up a local query server. This query server implements the prediction algorithm developed in Section 4. The API exported by the library enables applications to query for information on paths between (src, dst) IP address pairs in batches of arbitrary sizes. In future work, we plan to support remote queries so that only one local host need download the atlas.
Keeping Atlas Up-to-date: Paths and path properties on the Internet change over time. Hence, iNano's atlas needs to be kept up-to-date to reflect current network conditions. Fortunately, the stationarity of Internet routing keeps the bandwidth cost of such updates low. A significant fraction of Internet routes are stationary [40] across days and path properties are stationary [60,30] on the timescale of several hours. Therefore, as we show later in our evaluation, the difference between the atlases of consecutive days can typically be represented in approximately 1MB. As a result, once an end-host fetches the complete atlas, it can maintain an up-to-date atlas thereafter by downloading a daily 1MB update also as a swarmed file download.
6 Evaluation
In this section, we evaluate the accuracy of iNano's predictions of paths and path properties, and study the contribution that each of iNano's components makes towards its predictive ability. We also quantify the stationarity of iNano's atlas across days, iNano's storage requirements, and how the atlas size would grow with additional vantage points.
6.1 Size of the atlas
First, we discuss the typical size of iNano's atlas and then evaluate how this size would scale with measurements from more vantage points.
6.1.1 What is the current size of the atlas?
| Dataset | No. of entries | Compressed file | ||
| size (in MB) | ||||
| Atlas | Delta | Atlas | Delta | |
| Inter-cluster links with latencies | 309K | 121K | 1.99 | 0.49 |
| Link loss rates | 47K | 65K | 0.21 | 0.29 |
| Prefix to cluster | 140K | 0 | 0.76 | 0 |
| Prefix to AS | 287K | 0 | 1.67 | 0 |
| AS degrees | 28K | 0 | 0.09 | 0 |
| AS three-tuples | 1.05M | 230K | 1.23 | 0.56 |
| AS preferences | 9K | 0 | 0.03 | 0 |
| Provider mappings | 33K | 0 | 0.63 | 0 |
| Total | 6.61 | 1.34 | ||
We describe a typical day's atlas that we use for most of the evaluation in this section. We leverage PlanetLab nodes as vantage points for gathering the iNano atlas. The atlas we use in our evaluation comprises traceroutes from 197 PlanetLab nodes to one destination each in 140K prefixes. All of these traceroutes were gathered over the course of a day. After alias resolution and clustering, 85K distinct clusters are present in the atlas, with 309K links between them. The dataset obtained by combining these inter-cluster links annotated with latencies and loss rates, observed AS 3-tuples, inferred AS preferences, and the mapping of ASes to their providers is roughly 6.6MB in size. AS 3-tuples, the dataset with the most number of entries, are highly amenable to compression because only 2500 ASes, less than 10% of all the ASes in the atlas, occur as the middle component of any 3-tuple. Table 2 shows the size associated with each of these components of the atlas.
6.1.2 Does iNano's atlas scale w.r.t vantage points?
iNano uses measurements from end-hosts to improve prediction accuracy for asymmetric routes. However, adding more measurements could significantly inflate the size of iNano's atlas, questioning the basic tenet of our work-is the atlas still tractable if it includes measurements from millions of end-hosts?
To study this question, we use the DIMES measurement infrastructure [50]. The DIMES project runs an Internet measurement agent on a few thousand end-hosts distributed worldwide. We issued traceroutes from 845 DIMES agents to 100 randomly chosen destinations each over the course of a week.
The addition of measurements from more vantage points primarily impacts the number of inter-cluster links and the number of AS three-tuples in the atlas. As stated previously, measurements from PlanetLab find approximately 309K links and 1.05M AS three-tuples. Including the measurements from the 845 DIMES agents into the atlas added approximately 16K links and 14K AS three-tuples in total. Even though the addition of links from more vantage points is likely to be sublinear in practice, we extrapolate linearly to get a conservative estimate of the increase in the size of the atlas if we had measurements from all of the Internet's edge. Including traceroutes from end-hosts in all 100K prefixes at the Internet's edge would increase the number of links in the atlas from 309K to approximately 2.2M (16K new links added for every 845 hosts), an eight-fold increase, and the number of AS three-tuples from 1.05M to 2.7M (14K new three-tuples for every 845 hosts), a three-fold increase. Assuming this data is as compressible as the PlanetLab data, this would add 18MB to the atlas and 5MB to the daily update. It is future work to determine how much of this data is truly needed, discarding information that adds little in terms of added accuracy.
6.2 Stationarity of measurements
iNano refreshes its atlas once every day. To evaluate whether the interval of a day between updates suffices, we examine the stationarity of the two kinds of measurements-traceroutes and loss rate measurements-used to construct iNano's atlas. Our link latencies do not capture transmission and queueing delays, and hence, are extremely stable. We then present the size of the difference between successive atlases that arises as a result of the stationarity in measurements.
6.2.1 How stationary are routes?
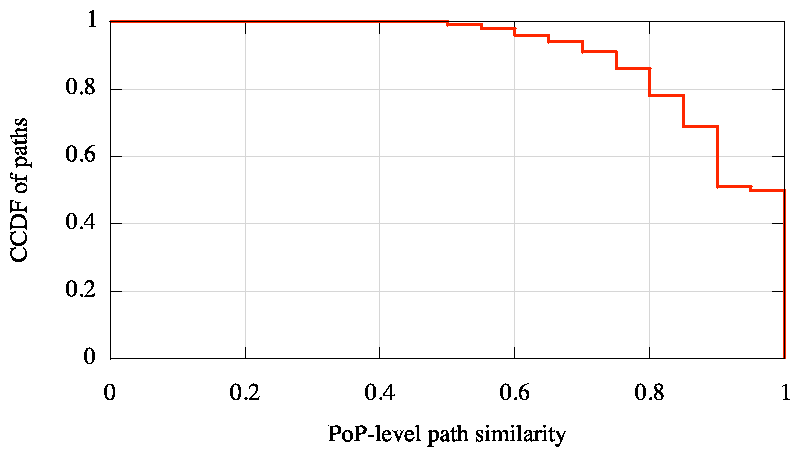 |
We studied the stationarity of routing by comparing the traceroutes measured from each of 195 PlanetLab nodes to destinations in 140K prefixes on successive days. Since iNano only considers the Internet topology at the granularity of clusters corresponding to PoPs, we map traceroutes to cluster-level paths for comparison. We compared every path between a PlanetLab node and a destination on one day with the same path the next day using the path similarity metric [22,29]. The similarity metric compares two paths as the ratio of the size of the intersection to the size of the union, of the sets of clusters in each of the paths; the ordering of clusters in the paths is not considered. The maximum value of this metric is 1 when both paths pass through exactly the same set of clusters, and the minimum value is 0 when the paths are completely disjoint. Figure 4 shows the distribution of PoP-level path similarity we obtained by comparing paths across consecutive days, grouping the similarity values into bins of 0.05. 91% of the paths on the first day have a similarity of at least 0.75 with the corresponding paths measured the next day, 68% have a similarity of at least 0.9, and 50% remain identical.
The main prior work on studying path stationarity has been by Paxson [40] and Zhang et al. [60]. Both observed more stationarity in routes than we do-Paxson found 68% of paths to be identical across days at the granularity of routers, and Zhang et al. found the same number to be more than 75%. We believe the difference in our findings is due to our significantly larger dataset. Paxson's measurement dataset included traceroutes between 27 vantage points and Zhang et al. used traceroutes between 220 vantage points. In contrast, our analysis of path stationarity uses traceroutes from 195 vantage points to 140K destinations each.
6.2.2 How stationary are loss rates?
To evaluate the stationarity of packet loss, we probed paths from 201 PlanetLab nodes to destinations in 5000 randomly chosen prefixes each. We sent out 100 ICMP probes of size 1KB on each path, with successive probes separated by 2 seconds, and determined the fraction of probes for which we received no response. We repeated these loss measurements 6 hours later. We found that 66% of paths on which we originally observed packet loss continued to be lossy 6 hours later. We also repeated these measurements 12 hours and 24 hours after the original measurements. The fraction of lossy paths that continued to remain so decreased from 66% to 53% when the interval between measurements was increased from 6 hours to 12 hours but remained steady at 53% when the interval was increased further to 24 hours.
6.2.3 How stationary is iNano's atlas?
As a result of the significant stationarity seen in both paths and path properties over the interval of a day, the difference between iNano's atlases on consecutive days is much smaller in size than the atlas itself. To update the atlas from the previous day, iNano ships the union of the old entries not present any more and new entries added to the inter-cluster links, link loss rates, and observed AS three-tuples datasets. The size of the link loss rates delta is larger than the loss rates dataset itself because we have to update a link's loss rate not just when it changes from being lossless to lossy (or vice-versa), as in our study on stationarity of loss above, but also when the link's loss rate changes. All the other datasets do not change on a day-to-day basis and hence, are updated in full only once a month. Table 2 shows that the typical difference is 1.34MB in size, less than one-fifth the typical size of a complete atlas. This implies that once an end-host downloads iNano's atlas, it can keep its local information up-to-date by fetching a significantly smaller update daily thereafter.
6.3 Accuracy of Predictions
We next evaluate the accuracy of iNano's predictions of both paths and path properties. From the 197 vantage points used in gathering the atlas described in Section 6.1.1, we choose a subset of 37 at random as our representative end-hosts. We pick 100 random traceroutes performed from each of them. After discarding paths that do not reach the destination or have AS-level loops, we are left with a validation set of 2816 paths. To predict the paths and path properties from one of the 37 sources, we include links from all traceroutes from the remaining 196 vantage points in the TO_DST plane and links from 100 other randomly chosen traceroutes from this source in the FROM_SRC plane.
6.3.1 Can iNano predict AS paths accurately?
 |
We evaluate the accuracy of iNano's ability to predict the AS paths in our validation set. We evaluate the accuracy of iNano's path prediction only at AS-level and not at PoP-level because our dataset clustering router interfaces into PoPs is complete. As a result, when our clustering indicates that two PoP-level paths are not identical, it is hard to say whether the difference is because of the incompleteness of our clustering data or they are indeed different. In contrast, our mapping from IPs to ASes is significantly more comprehensive.
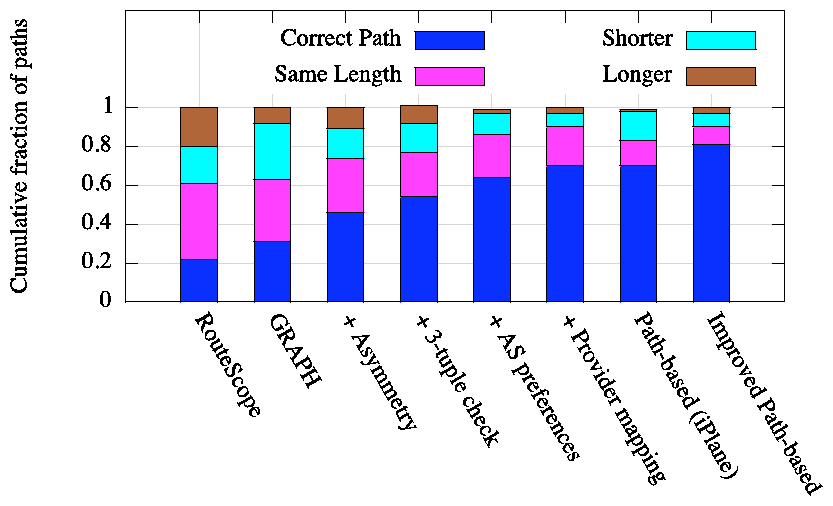
Figure 5 shows the improvement in accuracy of AS path prediction as each component of iNano is incorporated into the GRAPH algorithm. The fraction of paths for which we predict the AS path exactly right increases from 31% with GRAPH to 70% with all components of iNano included. Each of the four techniques that iNano uses significantly improves iNano's ability to predict paths. In fact, our final predictive model achieves the same AS path accuracy as iPlane's path composition technique, which uses a path-based dataset two orders of magnitude larger than iNano's link-based atlas. Furthermore, iNano outdoes path composition in the ability to predict AS path length.
Figure 5 also compares iNano's AS path prediction accuracy with that of RouteScope [32], the only prior work that predicts AS paths from a graph representation of Internet topology. First, RouteScope computes relationships between ASes using an observed set of AS paths as input. However, to predict the path between a (src, dst) pair, it needs only the AS-level graph of the Internet. RouteScope computes the set of shortest AS paths determined to be valley-free between the AS of src and the AS of dst. For the problem setting targeted by iNano, a single predicted path is required to estimate end-to-end performance. Therefore, to evaluate the utility of RouteScope in this setting, we choose one path at random from the set of paths returned by RouteScope for each (src, dst) pair. RouteScope's accuracy at predicting AS path length is only as good as that of GRAPH, and its accuracy at predicting the correct AS path is worse than GRAPH's. iNano's significantly better accuracy stems from its modeling of Internet routing at PoP-level instead of AS-level and its modeling of routing with techniques beyond simple valley-free routing.
iNano's techniques are also applicable to a structural approach that works by composing path segments. We incorporate these techniques into iPlane's path composition algorithm to improve the accuracy of prediction using an atlas of paths. When two path segments are being spliced together, we check whether the sequence of ASes prior to, at, and after the point of intersection exists in our database of 3-tuples. We also ensure that AS preferences are enforced when multiple candidate intersections pass the 3-tuple check. Figure 5 shows that the modified path composition technique increases iPlane's ability to predict AS paths from 70% to 81%.
The ability to predict paths using either iNano or path composition is limited by two factors, the comprehensiveness of the atlas measured from our vantage points and the accuracy of our inferred routing policies. We quantified the contribution of the former to the inaccuracy in path predictions as follows. For each path in our validation set, we determined whether all the inter-cluster links on the path were present in the corresponding atlas used to predict the path. 7% of paths were such that at least one of the inter-cluster links along the path was not observed in the atlas used for prediction. Therefore, if we had better coverage of the Internet's topology with measurements from more vantage points, the accuracy of path prediction could increase to up to 77% using iNano and to up to 88% using path composition.
6.3.2 How accurately can iNano estimate path properties?
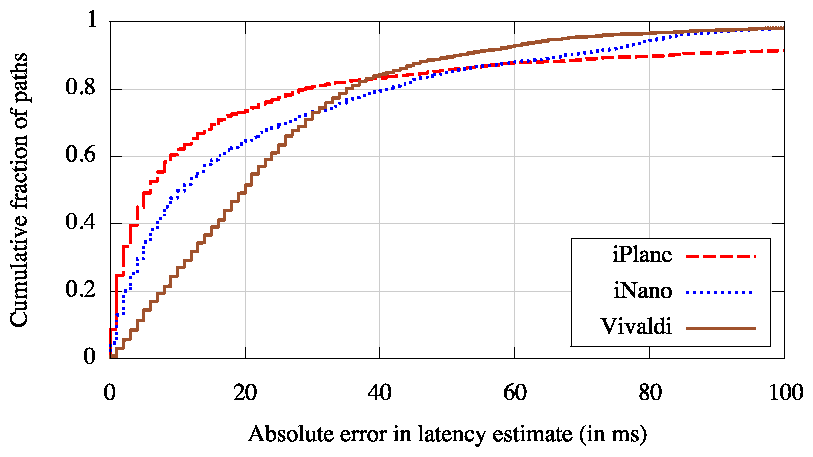 |
Next, we evaluate iNano's ability to estimate latencies along paths to arbitrary end-hosts. For each of the paths used in our evaluation of path prediction accuracy, we compose iNano's link latency estimates along the predicted forward and reverse paths to derive an estimate for the end-to-end latency. Figure 6 shows the error in iNano's latency estimates. We derive latency estimates for the same paths using the path-composition technique of iPlane [30] and using Vivaldi [13], a popular network coordinate system. iNano's median latency estimation error is 11ms, as compared to a median error of 20ms with Vivaldi. The path composition technique yields an even lower median error of 6ms, partly because of its better accuracy at predicting paths and partly because estimates of latencies along path segments tend to be more accurate than the sum of individual links.
However, the order of the three lines is reversed in the tail. iNano yields better latency estimates than the path composition technique in the tail because of differences in the methodology used to obtain link latencies for the former and path segment latencies for the latter. Our techniques for inferring link latencies identify and use measurements obtained by symmetric traversal of links [28], whereas our latency estimates of path segments do not. Like in iPlane [30], our latency estimates for path segments are obtained by just subtracting RTTs measured in traceroutes. The fact that Vivaldi produces better latency estimates in the tail than both iNano and path composition shows the significant room for improvement in our latency estimates for both links and path segments.
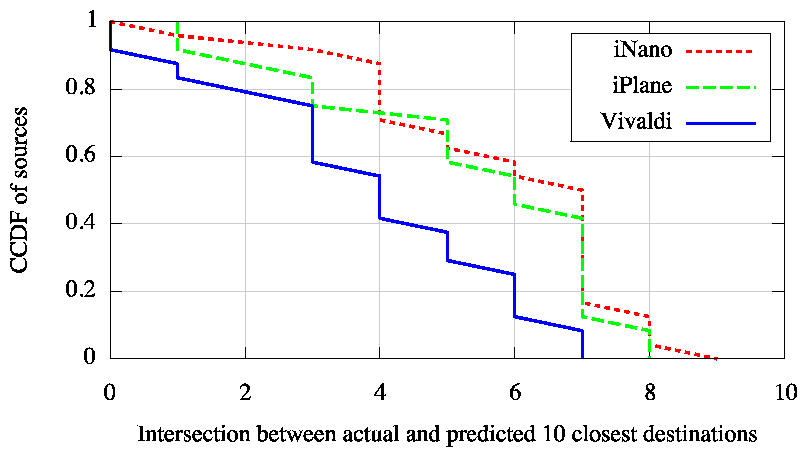 |
Applications such as peer selection and detour routing benefit from the ability to discern which destinations have low latency from a source. We therefore also assess latency estimation from the perspective of ranking different destinations in terms of latency from a common source. To quantify each technique's predictive ability on this criterion, we use the following metric. From each source, we determine the 10 closest nodes in terms of actual measured RTT among the 100 destinations per source in our validation set. We then do the same using estimated latencies and compute the intersection between the actual and predicted sets of 10 closest nodes. Figure 7 plots the cardinality of this intersection for each source in our validation set. iNano's ability to rank paths is significantly better than that of Vivaldi, while being comparable to the path-based approach.
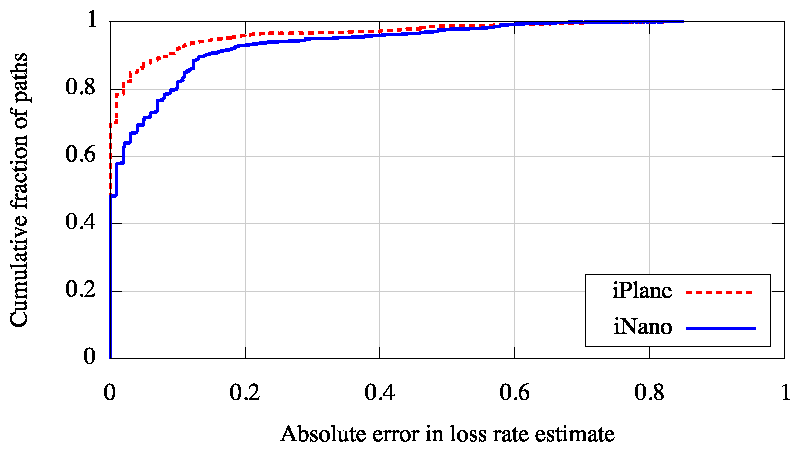 |
We next consider how well iNano can predict loss rates. We measured the loss rates along each of our validation paths and also measured the loss rate of each inter-cluster link in our atlas. We then use iNano to estimate the loss rate by composing the loss rates of the links along the predicted forward and reverse paths. Figure 8 plots the accuracy of iNano's loss rate estimates. Since coordinate systems, such as Vivaldi, can only estimate latency, we restrict our comparison to iPlane's path composition technique in the case of loss rate. iNano approximates path-based estimates with a much smaller atlas.
7 Applications
Our motivation in building iNano is to provide information on Internet paths to peer-to-peer applications. Therefore, we investigate the utility of the iNano library by using it in three sample peer-to-peer applications-peer-to-peer file transfer, voice-over-IP, and detour routing around failures.
7.1 P2P file transfer
| |
| (a) | |
| |
| (b) |
The next generation of content distribution networks (CDNs) are moving away from server-based deployments to client-based models. In contrast to services like Akamai [6], several alternatives [45,38,25] have recently emerged that perform content delivery by utilizing client end-hosts for storage and bandwidth. In such client-based CDNs, which are not centrally managed, a common problem is to determine the best replica for a given client. iNano enables clients to make this decision locally.
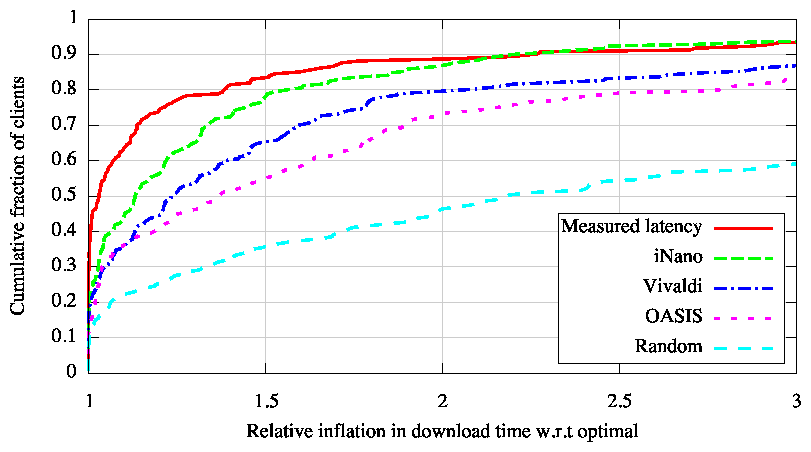
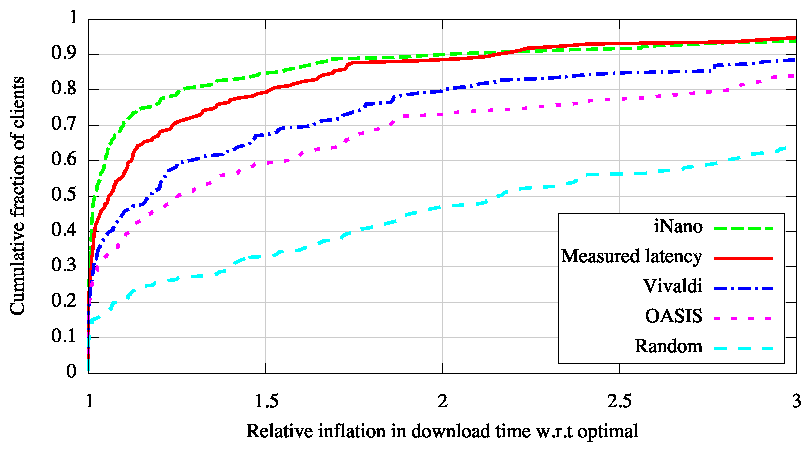
To evaluate the utility of iNano in client-based content-delivery systems, we emulated such a system as follows. We considered 199 PlanetLab nodes as clients. We resolved an Akamai-zed DNS name from these nodes to discover 199 Akamai servers. For each client, we then determined the set of replicas that host the content of its interest by choosing 5 Akamai servers at random 6, independently for every client. We then determined the best replica for every client using four different sources of path information-1) measured latencies, 2) latency estimates from Vivaldi [13], 3) latency estimates from OASIS [18], a server-selection system used by many CDNs deployed on PlanetLab, and 4) latency and loss rate estimates from iNano. We also consider the strategy of choosing replicas at random. We evaluated each strategy by downloading from every client a file from each replica. We compare the download times for each strategy with the optimal, which is the minimum of the download times from the 5 replicas associated with the client.
Figure 9 shows the results of this experiment. First, we downloaded a 30KB file wherein we only used iNano's estimates of path latency, because short TCP transfers are dominated by latency [8]. iNano closely tracks the performance obtained with measured latencies and is significantly better than the performance obtained with the use of Vivaldi or OASIS. We then repeated this experiment for a 1.5MB file. In this setting, we use iNano's latency and loss rate estimates in combination to choose the replica that would maximize TCP throughput based on the PFTK model [37]. iNano's predictions of loss rates enable it to choose replicas that deliver significantly better download performance than that obtained using measured latencies. Vivaldi and OASIS, restricted to modeling path latency, continue to yield poorer performance.
Unlike our experimental evaluation, in practice, a P2P CDN may perform a transfer in parallel across multiple paths assuming that at least one of those paths will provide good performance. iNano can be of benefit to such applications in two ways. First, in applications that transmit video, iNano can reduce the bootstrapping time for the video to load by helping prune down a potentially large set of path alternatives to a small set of good paths used for the transfer, without performing any measurements. Second, by enabling the application to focus in on the good paths quickly, iNano reduces the redundant traffic sent by the application that either gets dropped on lossy paths or is used just for measurement.
7.2 Voice-over-IP
 |
Voice-over-IP (VoIP) has emerged as a popular peer-to-peer application in recent years. VoIP applications such as Skype [52] allow end-hosts that are both behind NATs to talk to each other by routing packets via another end-host that serves as a relay. Picking the right relay is vital to ensure reasonable quality of the end-to-end call [46].
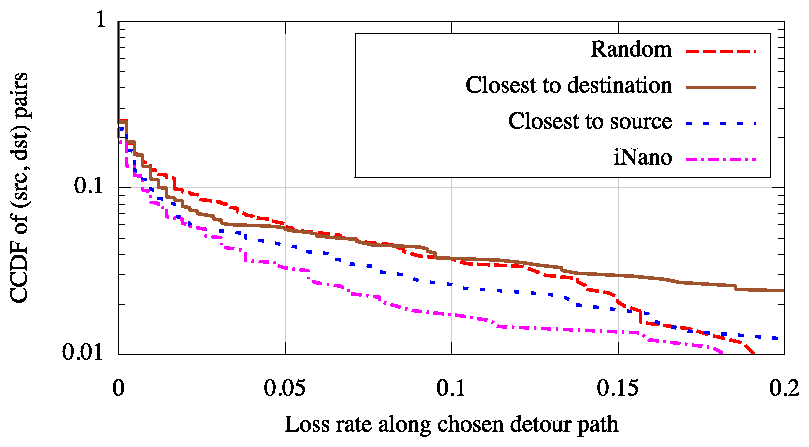
We emulated a VoIP application by considering 119 PlanetLab nodes as representative end-hosts. We chose 1200 (source, destination) pairs at random and emulated a VoIP call between each such pair by sending a 10KBps constant bitrate UDP packet stream from the source to the destination. For each call, we consider all end-hosts other than the source and destination to be potential relays. We use iNano to pick the 10 relays that minimize the predicted loss rate and then choose the one amongst these that minimizes end-to-end latency. We compare this strategy of choosing relays with three other strategies-1) closest to source based on measured latency, 2) closest to destination based on measured latency, and 3) random.
Figure 10 compares the quality of the relay nodes chosen by using iNano's estimates of latency and loss rate with the choices made using the other strategies. Paths via relay nodes chosen by iNano see significantly less packet loss compared to the alternatives.
7.3 Detouring around failures
 |
Several Internet measurement studies [40,60,15,20] have shown that the typical availability of an Internet path is "two-nines", i.e., 99%. This level of availability falls well short of that measured for the telephone network [26]. One of the solutions proposed to mitigate this problem is detour routing [48]. When a source is unable to reach a destination, the source can attempt to contact the destination instead by routing its packets via another end-host that serves as a detour. Previous solutions for improving availability with detour routing implement one of three approaches-1) constantly monitor paths between all pairs of end-hosts [7], 2) constantly monitor paths between all pairs of detour nodes [1] and have end-hosts route through nearby detour nodes, or 3) detour via a small randomly chosen set of end-hosts [20]. All-pairs monitoring is infeasible at Internet-scale, monitoring paths only between detour nodes ignores failures on paths from end-hosts to nearby detour nodes, and a small randomly chosen set of detours will not suffice for widespread outages.
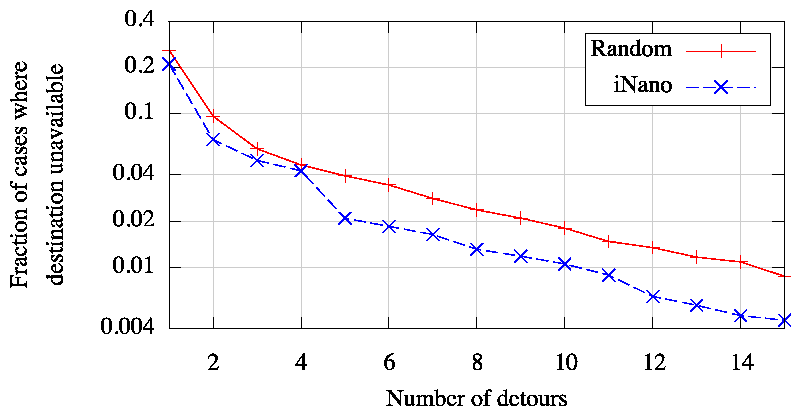
We explore a new way of routing around failures by choosing detour nodes that maximize the disjointness between the detour path and the direct path. When a source is unable to reach a destination, we use iNano to predict the direct path from the source to the destination as well as the detour path via each of the available intermediaries. We then rank the detour paths based on the number of PoPs and ASes shared by their predicted paths. We choose the (k+1)th detour node in this ranking to be the one that minimizes first the number of PoPs and second the number of ASes in common with the direct path and the k previously chosen detours. A strategy for recovering from failures by using N detours would try the first N detours in the ranking; the lower the value of N the less overhead incurred.
To compare the efficacy of the above strategy for routing around failures with SOSR's [20] strategy of using a few detours at random, we gathered the following measurements of path availability. We used 35 PlanetLab nodes and performed traceroutes continually for a week from each of them to destinations in 1000 randomly chosen prefixes, once every 15 minutes. Whenever a PlanetLab node was unable to reach a destination, we measured the availability of the detour path via the other 34 PlanetLab nodes. We consider for our analysis only the cases when at least 10% of our sources were simultaneously unable to reach the destination but at least 10% could.
Figure 11 compares our ability to route around failures by intelligently choosing detours using iNano's path predictions as opposed to choosing detours at random. For the same number of detour paths, using iNano reduces the fraction of cases when the destination is unreachable by roughly a factor of 2. For example, the use of 5 detour paths leaves the destinations unreachable in 2% of cases compared to 4% of cases with the random strategy.
8 Related Work
Our work benefits from a decade of work in Internet performance prediction [49,17] and network measurement [51,55]. Compared to most prior work, our goal is different: accurate prediction of sophisticated Internet performance metrics from lightweight end-hosts, which requires us to aggressively explore the trade-off between accuracy and representation size.
8.1 Latency prediction
IDMaps [17] pioneered the idea of a network information service that provides latency information between arbitrary end-hosts on the Internet. IDMaps issues pings from a set of vantage points to all participating end-hosts and also measures latencies between all pairs of vantage points. As more vantage points are added, the size of IDMaps' measurement data grows proportional to the square of the number of vantage points. Therefore, IDMaps uses a spanner-graph representation to compress its data. iNano tackles a different compression problem, that of compactly representing information encoded in the forwarding tables of all routers in the Internet.
Ng et al. [35] showed that Internet nodes could be embedded in a Euclidean coordinate space. The strength of the approach is that it is 1) simple because it treats the underlying network as a blackbox, and 2) lightweight because only a few bytes of coordinates per node need be stored. A large body of work has since refined this basic approach to provide decentralization [36,13], improved computational efficiency [56], resilience to measurement error [12,13], security [12], and accuracy. The techniques used to minimize error include Simplex minimization [12,36], Principal Component Analysis (PCA) [27,56], and spring relaxation [13].
The network coordinates approach poses two problems for our goals. First, the approach has been shown capable of predicting latencies, but it is unclear how to adapt the approach to other metrics that do not obey linear composition, such as loss rate. Second, the approach is fundamentally limited in accuracy. For example, about half of all Internet routes are known to be asymmetric [40] and a significant fraction are known to possess shorter detour routes [48]. However, common embedding techniques based on metric spaces will predict symmetric latencies and fail to predict detour routes when triangle inequality is violated. This limits the applicability of the approach for many applications.
8.2 Prediction of multiple metrics
Sequoia [43] attempts to embed nodes on to a "virtual prediction tree". Edges of the tree are annotated with latency and the latency between two nodes is predicted as the length of the path connecting them. Unlike other coordinate systems, Sequoia is also extensible to bandwidth. However, it continues to use metric embeddings that predict symmetric routes with no detour routes. Akamai's SureRoute [1] service optimizes transfers between end-hosts by routing through a mesh of detour nodes. End-hosts are routed through nearby detour nodes and the optimal path through the mesh of detour nodes is determined by constant monitoring. However, the performance along a path between two end-hosts is not necessarily the same as on the path via their nearby detour nodes.
8.3 Structural inference
iNano's structural inference approach has been previously used in iPlane. However, unlike iNano, iPlane adopts a centralized architecture that scales poorly to 1) Internet-scale query loads, and 2) more vantage points. iPlane uses an atlas of observed paths, whose size is proportional to the number of vantage points times the number of destinations probed times the average path length. With iPlane's current set of vantage points and destinations, the size of its atlas is already over 1GB. As more vantage points contribute measurements, iPlane's accuracy will increase, but at the cost of blowing up the size of its atlas. iPlane's large atlas has the implication that its query engine can only be hosted on dedicated servers but not on typical end-hosts. iNano's atlas instead comprises link-level, not path-level, information of the Internet structure. Routing policies encoded in iPlane's set of observed paths are replaced by iNano's compact representation of the same.
8.4 AS path inference
iNano's main focus is on predicting path performance between arbitrary end-hosts, while predicting the path between them. Prior work has looked at a part of this problem, inference of AS paths.
Mao et al. [32] describe a structural inference approach, RouteScope, to infer AS-level paths. They use constrained optimization to model aspects of interdomain policy routing such as customer < peer < provider and valley-free routing, and use additional measurement techniques to observe routes from multihomed prefixes. Our evaluation in Section 6 shows that iNano's ability to predict AS paths is significantly better than that of RouteScope, with iNano predicting the AS path correctly for more than twice as many paths in our validation set.
Qiu and Gao [42] build on RouteScope by using observed AS paths as constraints in predicting paths. Muhlbauer et al. [34] attempt to develop a hybrid model of Internet routing that lies in between a blackbox and a structure inference approach. They introduce "quasi-routers" to model the presence of multiple border routers in an AS based on an observed set of routes. Their approach can predict the training set exactly and achieves 50% prediction accuracy for unobserved routes. Both these pieces of work require a set of AS paths to make predictions; an atlas of paths is not compact enough to serve iNano's goal of distributing the atlas to end-hosts.
9 Conclusions
Our contribution is a practical one. Today, there is a gap between research techniques for Internet performance prediction, and the scalability and low-overhead desired by large-scale P2P applications. iPlane Nano is a lightweight Internet path performance prediction engine that applications can use today at low cost. To make this work, we develop a model of Internet routing that can predict PoP-level paths between arbitrary end-hosts with an atlas that is less than 7MB in size and can be updated with roughly 1MB/day. The compact nature of the atlas enables applications to have their clients download the atlas and process queries locally. Furthermore, because the atlas is the same for all end-hosts, it can be disseminated to clients at low cost by using common P2P filesharing protocols, and thus largely using client bandwidths. Our evaluation of iPlane Nano demonstrated the accuracy of its predictions and its utility in improving the performance of P2P applications.
Acknowledgments
We thank the DIMES team for their help in gathering data used in our evaluation from the DIMES infrastructure. We would like to thank Jay Lorch and the anonymous NSDI reviewers for their valuable feedback on earlier versions of this paper. We also thank Venugopalan Ramasubramanian for serving as our shepherd. This research was partially supported by Cisco, Google, and by the National Science Foundation under Grants CNS-0435065 and CNS-0721779.
References
Footnotes:
1University of California, San Diego
2University of Washington
3University of Massachusetts Amherst
4A Point-of-Presence (PoP) of an AS is the set of routers in that AS in the same location.
5Customer ASes pay their providers while peers connect to each other at no cost.
6We used such a setup instead of using PlanetLab nodes as replicas because the locations of PlanetLab nodes are hard-coded into OASIS.