Harsha V. Madhyastha
Tomas Isdal
Michael Piatek
Colin Dixon
Thomas Anderson
Arvind Krishnamurthy
Department of Computer Science and Engineering, University of Washington
Arun Venkataramani
Department of Computer Science, University of Massachusetts Amherst
In this paper, we present the design, implementation, and evaluation of iPlane, a scalable service providing accurate predictions of Internet path performance for emerging overlay services. Unlike the more common black box latency prediction techniques in use today, iPlane adopts a structural approach and predicts end-to-end path performance by composing the performance of measured segments of Internet paths. For the paths we observed, this method allows us to accurately and efficiently predict latency, bandwidth, capacity and loss rates between arbitrary Internet hosts. We demonstrate the feasibility and utility of the iPlane service by applying it to several representative overlay services in use today: content distribution, swarming peer-to-peer filesharing, and voice-over-IP. In each case, using iPlane's predictions leads to improved overlay performance.
The Internet by design is opaque to its applications, providing best effort packet delivery with little or no information about the likely performance or reliability characteristics of different paths. While this is a reasonable design for simple client-server applications, many emerging large-scale distributed services depend on richer information about the state of the network. For example, content distribution networks like Akamai [1], Coral [16], and CoDeeN [52] re-direct each client to the replica providing the best performance for that client. Likewise, voice-over-IP systems such as Skype [45] use relay nodes to bridge hosts behind NAT/firewalls, the selection of which can dramatically affect call quality [39]. Peer-to-peer file distribution, overlay multicast, distributed hash tables, and many other overlay services can benefit from peer selection based on different metrics of network performance such as latency, available bandwidth, and loss rate. Finally, the Internet itself can benefit from more information about itself, e.g., ISPs can monitor the global state of the Internet for reachability and root cause analysis, routing instability, and onset of DDoS attacks.
If Internet performance were easily predictable, its opaqueness might be an acceptable state of affairs. However, Internet behavior is well-known to be fickle, with local hot spots, transient (and partial) disconnectivity, and triangle inequality violations all being quite common [41,2]. Many large-scale services adapt to this state of affairs by building their own proprietary and application-specific information plane. Not only is this redundant, but it prevents new applications from leveraging information already gathered by other applications. The result is often sub-optimal. For example, most implementations of the file distribution tool BitTorrent choose peers at random (or at best using round trip latency estimates); since downloads are bandwidth-dependent, this can yield suboptimal download times. By some estimates, BitTorrent accounts for roughly a third of backbone traffic [37], so inefficiency at this scale is a serious concern. Moreover, implementing an information plane is often quite subtle, e.g., large-scale probing of end-hosts can raise intrusion alarms in edge networks as the traffic can resemble a DDoS attack. This is the most common source of complaints on PlanetLab [38].
To address this, several research efforts, such as IDMaps [15], GNP [34], Vivaldi [11], Meridian [54], and PlanetSeer [55] have investigated providing a common measurement infrastructure for distributed applications. These systems provide only a limited subset of the metrics of interest, most commonly latency between a pair of nodes, whereas most applications desire richer information such as loss rate and bandwidth. Second, by treating the Internet as a black box, most of these services abstract away network characteristics and atypical behavior--exactly the information of value for troubleshooting as well as improving performance. For example, the most common latency prediction methods use metric embeddings which are fundamentally incapable of predicting detour paths as such paths violate the triangle inequality [41,56]. More importantly, being agnostic to network structure, they cannot pinpoint failures, identify causes of poor performance, predict the effect of network topology changes, or assist applications with new functionality such as multipath routing.
In this paper, we move beyond mere latency prediction and develop a service to automatically infer sophisticated network behavior. We develop an Information Plane (iPlane) that continuously performs measurements to generate and maintain an annotated map of the Internet with a rich set of link and router attributes. iPlane uses structural information such as the router-level topology and autonomous system (AS) topology to predict paths between arbitrary nodes in the Internet. The path predictions are combined with measured characteristics of path segments to predict end-to-end path properties for a number of metrics such as latency, available bandwidth, and loss rate. iPlane can also analyze isolated anomalies or obtain a global view of network behavior by correlating observations from different parts of the Internet.
iPlane is designed as a service that distributed applications can query to obtain information about network conditions. Deploying iPlane as a shared service (as opposed to providing a library) has several benefits. First, a common iPlane can exploit temporal and spatial locality of queries across applications to minimize redundant measurement overhead. Second, iPlane can selectively refresh its knowledge of the IP address space based on real query workloads. More generally, iPlane can assimilate measurements made on behalf of all of its clients as well as incorporate information reported by clients to develop a more comprehensive model of Internet behavior over time. We note that all of these arguments have been recognized before [48,8,53,23], however a convincing validation has remained starkly absent.
Our primary contribution is in demonstrating the feasibility of a useful
iPlane, e.g., we can infer with high accuracy an annotated map of the
Internet every six hours with approximately ![]() Kbps of measurement traffic per PlanetLab node.
In addition, we develop:
Kbps of measurement traffic per PlanetLab node.
In addition, we develop:
iPlane is a modest step towards the vision of a knowledge plane pioneered by Clark et al. [8]. iPlane supplies information about the network and leaves the task of adapting or repairing to the client. Nevertheless, the collection, analysis, and distribution of Internet-scale measurement information is itself a challenging systems engineering problem and the focus of this paper. The goal of gathering a complete picture of the Internet has been recognized earlier in [48]. Our goal is more modest--to gather a coarse-grained map of the Internet sufficient to be of utility in improving overlay performance.
We start by discussing the requirements of an Information Plane for distributed services before presenting our design that meets these requirements.
|
iPlane is designed to be deployed as an application-level overlay network with the overlay nodes collectively coordinating the task of generating and maintaining an ``atlas'' of the Internet. The atlas is both extensive and detailed--it comprises the topology of the Internet core and the core's connectivity to representative targets in the edge networks, complete with a rich set of static attributes (such as link delay and link capacity), and recent observations of dynamic properties (such as routes between network elements, path loss rates, and path congestion). iPlane uses systematic active measurements to determine the attributes of the core routers and the links connecting them. In addition, the system performs opportunistic measurements by monitoring actual data transfers to/from end-hosts participating in BitTorrent swarms, thereby exposing characteristics of the edge of the network that typically cannot be obtained from one-way probing, e.g., capacities of access links.
Since it is impractical to probe every Internet end-host to generate the atlas, we cluster end-hosts on the basis of BGP atoms [4]. We approximate a client's performance by a representative target in the same atom as the client. If the client desires greater prediction accuracy, it can voluntarily perform some probes and contribute the paths that it discovers to iPlane; multi-homed clients can benefit from such an operational model. iPlane uses its collected repository of observed paths to predict end-to-end paths between any pair of end-hosts. This prediction is made by carefully composing partial segments of known Internet paths so as to exploit the similarity of Internet routes [31], i.e., routes from two nearby sources tend to converge when heading to the same destination. iPlane predicts a path by splicing a short path segment from the source to an intersection point from which a path going to the destination has been observed in the atlas. To determine intersections between paths, we cluster interfaces that are owned by the same AS and reside in the same PoP, and deem two paths to have intersected if they pass through the same cluster.
Once a path is predicted, iPlane simply composes the measured properties of the constituent path segments to predict the performance of the composite path. For instance, to make a latency prediction, iPlane simply adds the latencies associated with the individual path segments. Or, to predict the end-to-end bandwidth, iPlane computes the minimum of the bandwidth measured of each of the inter-cluster links along the predicted path, and the bandwidth of the client's access link, if available.
The rest of this section describes the techniques used to develop a functional iPlane that has wide coverage, incurs modest measurement load without unduly sacrificing coverage or detail, and uses topology structuring techniques to enable efficient measurement and accurate inference. The techniques are summarized in Table 1.
iPlane requires geographically distributed vantage points to map
the Internet topology and obtain a collection of observed paths.
PlanetLab servers, located at over ![]() sites around the world,
serve as the primary vantage points. We also enlist the use of
public Looking Glass/Traceroute servers for
low-intensity probing. Further, we are currently exploring the option of
using data from DIMES [43], a system for
aggregating low intensity measurements from normal PCs. Our primary tool for
determining the Internet
topology is traceroute, which allows us to identify the network
interfaces on the forward path from the probing entity to the
destination. (On PlanetLab, we use an optimized version of the
tool to reduce measurement load.)
Determining what
destinations to probe and how to convert the raw output of
traceroute to a structured topology is nontrivial, an issue we address
next.
sites around the world,
serve as the primary vantage points. We also enlist the use of
public Looking Glass/Traceroute servers for
low-intensity probing. Further, we are currently exploring the option of
using data from DIMES [43], a system for
aggregating low intensity measurements from normal PCs. Our primary tool for
determining the Internet
topology is traceroute, which allows us to identify the network
interfaces on the forward path from the probing entity to the
destination. (On PlanetLab, we use an optimized version of the
tool to reduce measurement load.)
Determining what
destinations to probe and how to convert the raw output of
traceroute to a structured topology is nontrivial, an issue we address
next.
BGP snapshots, such as those collected by RouteViews [33], are a good source of probe targets. iPlane achieves wide coverage for the topology mapping process by obtaining the list of all globally routable prefixes in BGP snapshots, and choosing within each prefix a target .1 address that responds to either ICMP or UDP probes. A .1 address is typically a router and is hence more likely to respond to probes than arbitrary end-hosts.
To reduce measurement load, iPlane clusters IP prefixes into BGP atoms [4] for generating the target list. A BGP atom is a set of prefixes, each of which has the same AS path to it from any given vantage point. BGP atoms can be regarded as representing the knee of the curve with respect to measurement efficiency--probing within an atom might find new routes, but it is less likely to do so [4]. This task of determining a representative set of IP addresses is performed relatively infrequently, typically once every two weeks.
iPlane uses the PlanetLab nodes to perform exhaustive and periodic probing of the representative targets. In addition, iPlane schedules probes from public traceroute servers to a small random set of BGP atoms, typically making a few tens of measurements during the course of a day. The public traceroute servers serve as a valuable source of information regarding local routing policies. Note that in the long run, a functioning iPlane may actually serve to decrease the load on the public traceroute servers as iPlane, rather than the traceroute servers themselves, can be consulted for information on the Internet topology.
Traceroute produces a list of network interfaces on the path from source to destination. However, interfaces on the same router, or in the same PoP, may have similar behavior. Hence, we partition network interfaces into ``clusters'' and use this more compact topology for more in-depth measurements and predictions. We define the clusters to include interfaces that are similar from a routing and performance perspective, i.e., interfaces belonging to the same PoP and interfaces within geographically nearby portions of the same AS [46]. Note that this clustering is performed on network interfaces in the Internet core, whereas the clustering of prefixes into BGP atoms was performed for end-host IP addresses. In fact, clustering addresses in the same prefix will be ineffective in the core as geographically distant interfaces are often assigned addresses in the same prefix.
First, iPlane identifies interfaces that belong to the same router. Interfaces that are potential alias candidates are identified using two different techniques. Employing the Mercator [19] technique, UDP probes are sent to a high-numbered port on every router interface observed in traceroutes. Interfaces that return responses with the same source address are considered as possible aliases. In addition, candidate alias pairs are also identified using the fact that interfaces on either end of a long-distance link are usually in the same /30 prefix. Candidate pairs that respond with similar IP-ID values to the UDP probes, and also respond with similar TTLs to the ICMP probes are deemed to be aliases. In one of our typical runs, of the 396,322 alias candidate pairs yielded by the Mercator technique, 340,580 pairs were determined to be aliases. The 918,619 additional alias candidate pairs obtained using the /30 heuristic yielded another 320,150 alias pairs.
Second, iPlane determines the DNS names assigned to as many network interfaces as possible. It then uses two sources of information - Rocketfuel's undns utility [47] and data from the Sarangworld project [40] - to determine the locations of these interfaces based on their DNS names. This step alone does not suffice for our purpose of clustering geographically co-located interfaces because: 1) several interfaces do not have a DNS name assigned to them, 2) rules for inferring the locations of all DNS names do not exist, and 3) incorrect locations are inferred for interfaces that have been misnamed. For IPs whose locations can be inferred from DNS names, the locations are validated by determining if they are consistent with the measured delays from traceroutes [28].
Third, to cluster interfaces for which a valid location was not determined, we develop an automated algorithm that clusters interfaces based on responses received from them when probed from a large number of vantage points. We probe all interfaces from all of iPlane's PlanetLab vantage points using ICMP ECHO probes. We use the TTL value in the response to estimate the number of hops on the reverse path back from every router to each of our vantage points. Our hypothesis is that routers in the same AS that are geographically nearby will have almost identical routing table entries and hence, take similar reverse paths back to each vantage point.
To translate this hypothesis into a clustering algorithm,
each interface is associated with a reverse path
length vector. This is a vector with as many components as the number
of vantage points, and the ![]() component is the length of the
reverse path from the interface back to the
component is the length of the
reverse path from the interface back to the ![]() vantage point.
We define the cluster distance between two vectors to be the L1
distance--the sum of the absolute differences between corresponding
components, divided by the number of components.
In our measurements, we have
observed that the cluster distance between reverse path length
vectors of co-located routers in an AS is normally less than
vantage point.
We define the cluster distance between two vectors to be the L1
distance--the sum of the absolute differences between corresponding
components, divided by the number of components.
In our measurements, we have
observed that the cluster distance between reverse path length
vectors of co-located routers in an AS is normally less than ![]() .
.
Based on the metric discussed above, we can now present a technique
for assigning interfaces without known locations to clusters.
We start by initializing our clusters
to contain those interfaces for which a location has been determined.
Interfaces that have been determined to be co-located in an
AS are in the same cluster.
For each cluster, we compute the median reverse path length vector,
whose ![]() component is the median of the
component is the median of the ![]() components of
the vectors corresponding to all interfaces in the cluster.
We then cluster all interfaces that do not belong to any
cluster as follows. For each interface, we determine the cluster in the same AS
as the interface, with whose median vector the interface's vector has
the least cluster distance. If this minimum cluster distance is less
than
components of
the vectors corresponding to all interfaces in the cluster.
We then cluster all interfaces that do not belong to any
cluster as follows. For each interface, we determine the cluster in the same AS
as the interface, with whose median vector the interface's vector has
the least cluster distance. If this minimum cluster distance is less
than ![]() , the interface is added to the chosen cluster, otherwise a new
singleton cluster is created. This clustering algorithm, when executed on a
typical traceroute output, clusters 762,701 interfaces into
54,530 clusters. 653,455 interfaces are in 10,713
clusters of size greater than
, the interface is added to the chosen cluster, otherwise a new
singleton cluster is created. This clustering algorithm, when executed on a
typical traceroute output, clusters 762,701 interfaces into
54,530 clusters. 653,455 interfaces are in 10,713
clusters of size greater than ![]() , while 21,217 interfaces are in
singleton clusters.
, while 21,217 interfaces are in
singleton clusters.
After clustering, iPlane can operate on a compact routing topology, where each node in the topology is a cluster of interfaces and each link connects two clusters. iPlane then seeks to determine a variety of link attributes that can be used to predict path performance. To achieve this goal, a centralized agent is used to distribute the measurement tasks such that each vantage point is assigned to repeatedly measure only a subset of the links. The centralized agent uses the compact routing topology to determine the assignments of measurement tasks to vantage points, communicates the assignment, and monitors the execution of the tasks. Only iPlane infrastructure nodes (namely, PlanetLab nodes) are used for these tasks.
There are three objectives to be satisfied in assigning measurement tasks to vantage points. First, we want to minimize the measurement load by measuring each link attribute from only a few vantage points (we employ more than one to correct for measurement noise). Second, the measurement should be load-balanced across all vantage points, i.e., each vantage point should perform a similar number of measurements. Third, in order to measure the properties of each link as accurately as possible, we measure every link in the topology from the vantage point that is closest to it.
We have developed a novel ``frontier'' algorithm to perform the assignment of tasks to vantage points. The algorithm works by growing a frontier rooted at each vantage point and having each vantage point measure only those links that are at its frontier. The centralized agent performs a Breadth-First-Search (BFS) over the measured topology in parallel from each of the vantage points. Whenever a vantage point is taken up for consideration, the algorithm performs a single step of the BFS by following one of the traceroute paths originating at the vantage point. If it encounters a link whose measurement task has been assigned already to another vantage point, it continues the BFS exploration until it finds a new link that has not been seen before. This process continues until all the link measurements have been assigned to some vantage point in the system.
The centralized agent uses the above algorithm to determine the assignment of tasks and then ships the tasklist to the respective vantage points. Each target link is identified by the traceroute path that the vantage point can use to reach the link and by its position within the traceroute path. If a vantage point is no longer capable of routing to the link due to route changes, the vantage point reports this to the centralized agent, which in turn reassigns the task to a different vantage point.
Most link attributes, however, cannot be directly determined by the
vantage points.
For instance, when measuring loss rates,
a vantage point can only measure the loss rate associated
with the entire path from the vantage point to the target link; the
loss rates of individual links have to be inferred as a
post-processing operation.
Once all vantage points
report their measurements back to the centralized agent, the agent can
perform the BFS style exploration of the topology to infer link
properties in the correct order.
For instance, assume that a vantage point ![]() had probed the path
had probed the path ![]() and obtained a (one-way) loss rate
measurement of
and obtained a (one-way) loss rate
measurement of ![]() for the entire path. The centralized agent can then infer
the loss rate along the link
for the entire path. The centralized agent can then infer
the loss rate along the link ![]() after inferring the loss
rates for each of the links in
after inferring the loss
rates for each of the links in ![]() , composing these individual
loss rates to compute the loss rate
, composing these individual
loss rates to compute the loss rate ![]() along the segment
along the segment ![]() , and then calculating the loss rate for
, and then calculating the loss rate for
![]() using the equation
using the equation
![]() .
Since the link property inference is performed as a BFS traversal, we
are guaranteed that loss rates for all the links along
.
Since the link property inference is performed as a BFS traversal, we
are guaranteed that loss rates for all the links along
![]() have been inferred before we consider the link
have been inferred before we consider the link ![]() .
.
In our current system, the centralized agent schedules and monitors roughly 2700K measurements per day, a management load that a single centralized agent can easily bear. Fault tolerance is an issue, but is addressed by a simple failover mechanism to a standby controller. Note that the processed data is served to applications from a replicated database to ensure high availability.
We next outline the details of the loss rate, bottleneck capacity and available bandwidth measurements performed from each vantage point. Previous research efforts have proposed specific ways to measure each of these properties; our goal is to integrate these techniques into a useful prediction system. Latencies of path segments can be derived directly from the traceroute data gathered while mapping the topology, and therefore do not need to be measured explicitly.
Loss Rate Measurements: We perform loss rate measurements along path segments from vantage points to routers in the core by sending out probes and determining the fraction of probes for which we get responses. We currently use the simple method of sending TTL-limited singleton ICMP probes with a 1000-byte payload. When the probe's TTL value expires at the target router, it responds with a ICMP error message, typically with a small payload. When a response is not received, one cannot determine whether the probe or the response was lost, but there is some evidence from previous studies that small packets are more likely to be preserved even when routers are congested [32]. We therefore currently attribute all of the packet loss to the forward path; the development of more accurate techniques is part of ongoing work.
Capacity Measurements: We perform capacity measurements using algorithms initially proposed by Bellovin [3] and Jacobson [24] that vary the packet size and determine the delay induced by increased packet sizes. For each packet size, a number of probes (typically 30-40) of that size are sent to an intermediate router and the minimum round-trip time is noted. The minimum round-trip time observed over many probes can be regarded as a baseline path latency measurement with minimal queueing delays. By performing this experiment for different packet sizes, one can determine the increased transmission cost per byte. When this experiment is performed for a sequence of network links in succession, the capacity of each link can be determined. Note that our capacity measurements may underestimate a cluster link if it consists of multiple parallel physical links.
Available Bandwidth Measurements: Once we have
link capacities, we can probe for available bandwidth along path
segments using packet dispersion techniques such as
Spruce [50], IGI [21], Pathload [25]. A
simple measurement is performed by sending a few, equally spaced,
short probes at the believed bottleneck capacity of the path segment, and
then measuring how much delay they induce. The slope of the delay
increase will indicate how
much background traffic arrived during the same time period as the
probe. For instance, if the probes are generated with a gap of
![]() through a path segment of capacity
through a path segment of capacity ![]() and if the
measured gap between between the probe replies is
and if the
measured gap between between the probe replies is ![]() , one
can estimate the available bandwidth as
, one
can estimate the available bandwidth as
![]() . An important detail
is that the packets have to be scheduled at the desired spacing, or
else the measurement is not valid. Fortunately, even on heavily
loaded PlanetLab nodes, it is possible to realize the desired
scheduling most of the time.
. An important detail
is that the packets have to be scheduled at the desired spacing, or
else the measurement is not valid. Fortunately, even on heavily
loaded PlanetLab nodes, it is possible to realize the desired
scheduling most of the time.
To provide a comprehensive data set on which to infer current properties of paths to end-hosts, it is necessary for iPlane to maintain an up-to-date map of the network that extends to the very edge. However, the measurement techniques outlined above are unlikely to work as they, as most other active measurements, require end-hosts to respond to unsolicited ICMP, UDP or TCP packet probes. Also, measurements to end-hosts are frequently misinterpreted by intrusion detection systems as attacks. Hence, we pursue an opportunistic approach to data collection--measuring paths to end-hosts while interacting with them over normal connections. We participate in the popular file-distribution application BitTorrent [9] and gather measurements from our exchanges with the peers in this swarming system. Note that BitTorrent has the further desirable property that anyone can connect to anyone, allowing us to arrange measurements of multiple paths to participating edge hosts.
BitTorrent is used daily by thousands of end users to distribute large files. BitTorrent is one example of a large class of swarming data distribution tools. By participating in several BitTorrent swarms, we have the opportunity to interact with a large pool of end-hosts. We measure properties of the paths to peers while exchanging data with them as part of the swarming system.
We currently gather two kinds of measurements using our opportunistic measurement infrastructure.
Next, we describe how to predict path properties between an arbitrary pair of nodes based on the above measurements. The prediction proceeds in two steps. First, we predict the forward and reverse paths connecting the two nodes. Second, we aggregate measured link-level properties to predict end-to-end path properties.
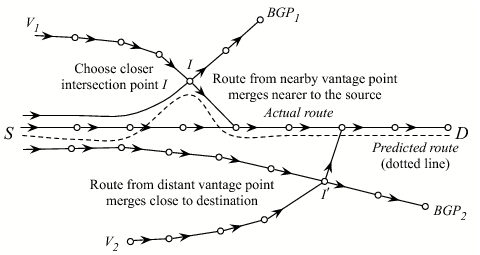 |
Path Prediction We use a technique we earlier
developed [31] based on composing observed path
segments to predict unknown paths. Consider a source ![]() and
destination
and
destination ![]() . If
. If ![]() is a vantage point, then we simply return the
measured path from
is a vantage point, then we simply return the
measured path from ![]() to
to ![]() . Else, we determine an appropriate
intersection point
. Else, we determine an appropriate
intersection point ![]() in the measured subgraph of the Internet such
that--(a) the AS hop count of the path
in the measured subgraph of the Internet such
that--(a) the AS hop count of the path ![]() is minimum, and (b)
the latency from
is minimum, and (b)
the latency from ![]() to the point where the path
to the point where the path ![]() exits the
first-hop AS is minimum, in that order (Figure 1). The underlying principle is similarity of
routes, i.e., with a sufficiently large number of vantage points, the
path to a destination (
exits the
first-hop AS is minimum, in that order (Figure 1). The underlying principle is similarity of
routes, i.e., with a sufficiently large number of vantage points, the
path to a destination (![]() ) from any node (
) from any node (![]() ) will be similar to the
path from a vantage point or router (
) will be similar to the
path from a vantage point or router (![]() ) located nearby. Condition
(a) encodes the default path selection criterion used by BGP in the
absence of conflicting local preference policies. Condition (b) encodes
the default early exit intradomain routing policy.
Note that the above
technique is guaranteed to return a path (albeit an inflated one), since
every path of the form
) located nearby. Condition
(a) encodes the default path selection criterion used by BGP in the
absence of conflicting local preference policies. Condition (b) encodes
the default early exit intradomain routing policy.
Note that the above
technique is guaranteed to return a path (albeit an inflated one), since
every path of the form ![]() , for each vantage point
, for each vantage point ![]() , belongs to
the measured subgraph.
, belongs to
the measured subgraph.
As we noted earlier, we make measurements to BGP atoms rather than
to all destinations.
In [31], we note that adding a small number of
measured paths originating from the client ![]() significantly improves the
prediction accuracy for paths sourced at
significantly improves the
prediction accuracy for paths sourced at ![]() . Using these measurements,
the path from
. Using these measurements,
the path from ![]() to
to ![]() is
is ![]() to
to ![]() to
to ![]() 's atom to
's atom to ![]() . If there
is a measurement of the last hop from
. If there
is a measurement of the last hop from ![]() 's atom to
's atom to ![]() , we use it;
otherwise, we estimate it using a representative node in the atom
(e.g., from BitTorrent measurements).
Briefly summarizing the main results from [31], we
can predict the AS path exactly right for around
, we use it;
otherwise, we estimate it using a representative node in the atom
(e.g., from BitTorrent measurements).
Briefly summarizing the main results from [31], we
can predict the AS path exactly right for around ![]() of the
paths evaluated, and the latency estimates obtained using this model
were significantly better than those yielded by
Vivaldi [11], a popular network coordinate system.
of the
paths evaluated, and the latency estimates obtained using this model
were significantly better than those yielded by
Vivaldi [11], a popular network coordinate system.
Path Properties Given predicted paths as above, we can
estimate end-to-end properties by aggregating link-level properties.
For example, we predict TCP
transfer time using widely accepted models [35,5].
For this, we separately predict the forward and reverse paths between the
source and the destination. The latency on the
forward path ![]() -
-![]() is estimated as the sum of the latency estimates for
each segment. We similarly estimate the latency along the
reverse path, and then compute the RTT between the two end-hosts to be
the sum of our latency estimates along the forward and reverse paths. The
loss rate on the predicted forward path is estimated from the
probability of a loss on any of its constituent links while bandwidth is
the minimum value across the links. The access link capacities of these
end-hosts, if available based on BitTorrent measurements to hosts in the
same
is estimated as the sum of the latency estimates for
each segment. We similarly estimate the latency along the
reverse path, and then compute the RTT between the two end-hosts to be
the sum of our latency estimates along the forward and reverse paths. The
loss rate on the predicted forward path is estimated from the
probability of a loss on any of its constituent links while bandwidth is
the minimum value across the links. The access link capacities of these
end-hosts, if available based on BitTorrent measurements to hosts in the
same ![]() prefixes, are also used to estimate the end-to-end bottleneck
bandwidth.
prefixes, are also used to estimate the end-to-end bottleneck
bandwidth.
Recently, He et al. [20] argued that the best way to accurately predict TCP throughput is to send TCP flows and use history-based predictors. Although we have not implemented these, our use of passive BitTorrent logs is amenable to incorporating such predictors.
iPlane allows untrusted users to contribute measurements, so it is vulnerable to attacks aimed at polluting its information. For instance, a client can claim to have better connectivity than actuality in order to improve its position within an overlay service that uses iPlane. iPlane reduces this risk by using client data only for those queries issued by the same client; falsified measurements will not affect the queries issued by other clients.
We do however trust traceroute servers to provide unbiased data, though the traceroute servers are not under our control. An ISP hosting a traceroute server might bias its replies from the server to better position its clients, for example, to attract more BitTorrent traffic and thereby generate more revenue. We have the ability to use verification to address this - compare the results from multiple vantage points for consistency - but have not implemented it yet.
The query interface exported by iPlane must be carefully designed to enable a diverse range of applications. Our current implementation of the query interface exposes a database-like view of path properties between every pair of end-hosts in the Internet. For every source-destination pair, there exists a row in the view with iPlane's predicted path between these hosts and the predicted latency, loss rate, and available bandwidth along this path. Any query to iPlane involves an SQL-like query on this view - selecting some rows and columns, joining the view with itself, sorting rows based on values in certain columns, and so on. The database view is merely an abstraction. iPlane does not compute apriori the entire table comprising predictions for every source-destination pair; instead it derives necessary table entries on-demand.
For example, a CDN can determine the closest replica to a given client by selecting those rows that predict the performance between the client and any of the CDN's replicas. A suitable replica can then be determined by sorting these rows based on a desired performance metric. To choose a good detour node for two end-hosts to conduct VoIP, the rows predicting performance from the given source can be joined with the set of rows predicting performance for the given destination. A good detour is one that occurs as the destination in the first view and as the source in the second view, such that the composed performance metrics from these rows is the best. These queries can be invoked in any one of the following ways.
Download the Internet Map: We have implemented a library that provides an interface to download the current snapshot of the entire annotated Internet map or a geographic region, to process the annotated map, and to export the above SQL-like view. An application simply links against and invokes the library locally.
On-the-fly Queries: Applications that do not wish to incur the costs of downloading the annotated map and keeping it up-to-date, can query a remote iPlane service node using non-local RPCs. Note that clients of CDNs, such as Akamai and Coral, typically tolerate some indirection overhead in determining the nearest replica. To support such applications, iPlane downloads the annotated map of the Internet to every PlanetLab site, and then provides an RPC interface to the data. Further, as some applications might need to make multiple back-to-back queries to process iPlane's measurements, we assist the application in lowering its overheads by allowing it to upload a script that can make multiple local invocations of iPlane's library. The current implementation requires that this script be written in Ruby, as Ruby scripts can be executed in a sandboxed environment and with bounded resources [49]. The output of the script's execution is returned as the response to the RPC.
Network Newspaper: Apart from downloading the Internet graph and issuing on-the-fly queries, a third model that we plan to support is a publish-subscribe interface that allows users to register for information updates about specific portions of the Internet graph. This interface allows users to subscribe to their ``view'' of the Internet, i.e., all paths originating from a user to all BGP atoms, or insert triggers to be notified of specific events, e.g., when a critical link fails. Implementing such an interface is part of our future work.
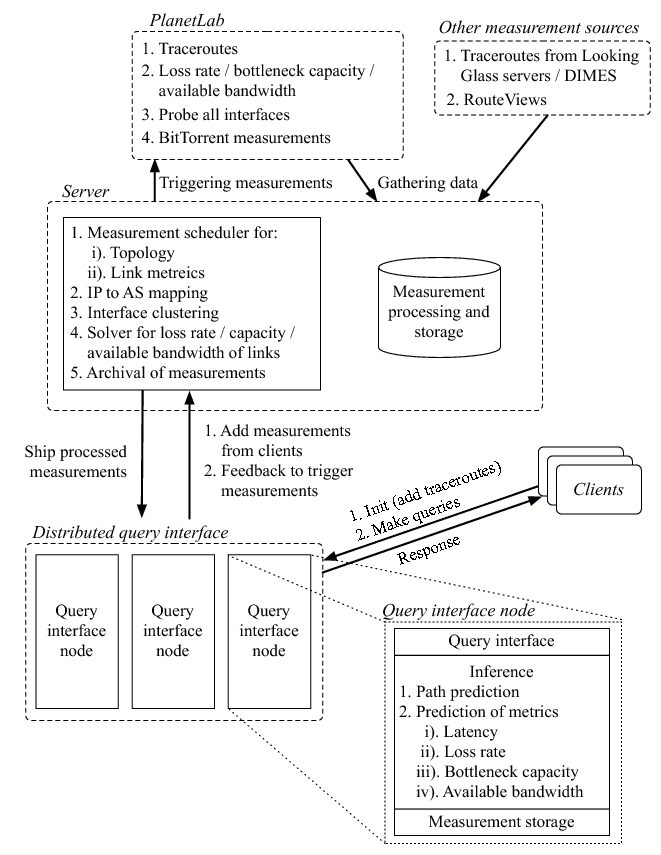
The various components in our current implementation of iPlane, and the interaction between these components is depicted in Figure 2.
In this section, we present details of our deployment of iPlane. We provide an overview of the measurements we conducted as part of our deployment. We also outline the tests we conducted to validate our measurements. All of our validation is performed on paths between PlanetLab nodes; our goal in the future is to use client measurements (e.g., DIMES [43]) to broaden the validation set. The number of PlanetLab nodes used varies with each experiment because of the variable availability of some nodes.
We first consider results from a typical run of our mapping process.
We performed traceroutes from PlanetLab nodes in ![]() distinct sites.
The targets for our trace-routes were
distinct sites.
The targets for our trace-routes were ![]() addresses
in each of 91,498 prefixes determined from the RouteViews BGP
snapshot, though measuring paths to one address in each BGP atom should
suffice. We probed all interfaces observed in our measured topology with
UDP and ICMP probes, and clustered the interfaces based on their
responses.
addresses
in each of 91,498 prefixes determined from the RouteViews BGP
snapshot, though measuring paths to one address in each BGP atom should
suffice. We probed all interfaces observed in our measured topology with
UDP and ICMP probes, and clustered the interfaces based on their
responses.
Once a map of the Internet's core was gathered, we employed our
``frontier'' BFS algorithm to determine paths to be probed from each of
the ![]() PlanetLab nodes present at the
PlanetLab nodes present at the ![]() sites used;
for link metrics, we use multiple nodes per
site. To determine the properties of 270,314
inter-cluster links seen in our measured topology, each vantage point was
assigned to measure only around 700 paths. Loss rate, capacity,
and available bandwidth
were measured for each of the assigned paths. These measurements
were then processed to determine properties for every
cluster-level link in our measured topology.
sites used;
for link metrics, we use multiple nodes per
site. To determine the properties of 270,314
inter-cluster links seen in our measured topology, each vantage point was
assigned to measure only around 700 paths. Loss rate, capacity,
and available bandwidth
were measured for each of the assigned paths. These measurements
were then processed to determine properties for every
cluster-level link in our measured topology.
To validate the predictive accuracy of iPlane,
we compared
properties of paths between PlanetLab nodes with the corresponding
values predicted by iPlane. We measured the latency and loss
rate along every path between any two PlanetLab nodes. To predict the
performance, we assume that we have the probe information collected by the
other ![]() sites, excluding the source and destination under consideration.
We then added 10 traceroutes from the source and destination to random
nodes to simulate the behavior of participating clients.
Each experiment was performed
independently to ensure no mixing of the measurement and validation set.
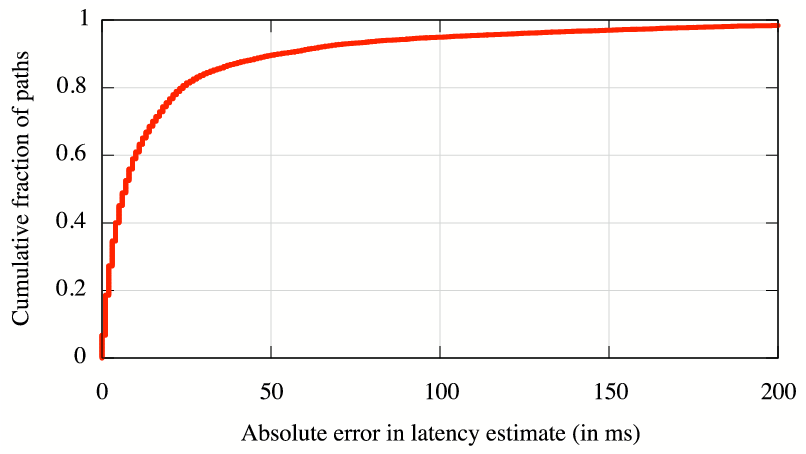
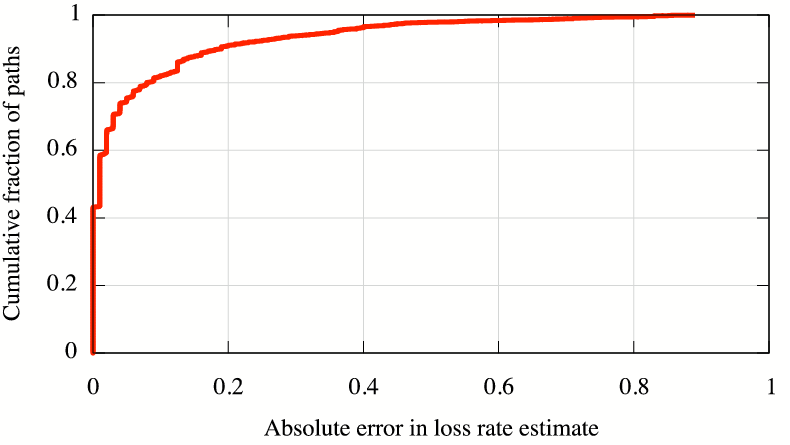
Figure 3 compares the latency and loss
rate estimates made by iPlane with the true values.
For
sites, excluding the source and destination under consideration.
We then added 10 traceroutes from the source and destination to random
nodes to simulate the behavior of participating clients.
Each experiment was performed
independently to ensure no mixing of the measurement and validation set.
Figure 3 compares the latency and loss
rate estimates made by iPlane with the true values.
For ![]() of paths, iPlane's latency estimates have error less than
of paths, iPlane's latency estimates have error less than
![]() ms, and for
ms, and for ![]() of paths, loss rate estimates have error less
than
of paths, loss rate estimates have error less
than ![]() .
.
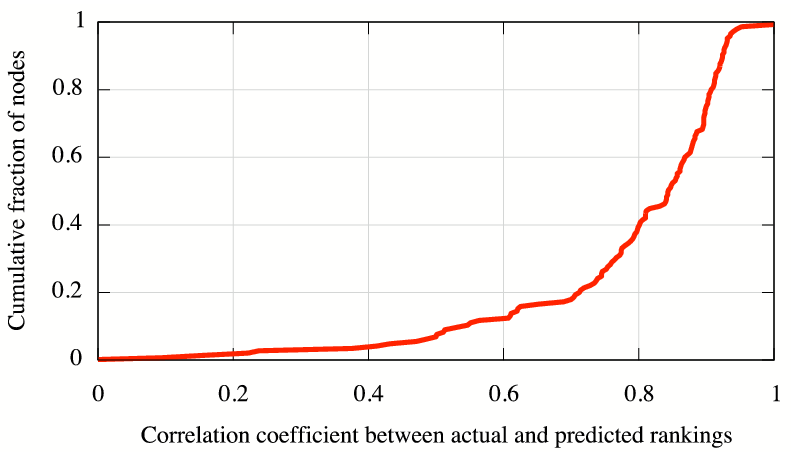
Further, we evaluated how predictive of path performance are iPlane's
estimates of latency and loss rate in combination.
The desired property of
these estimates is that they help distinguish between paths with good and
bad performance. We compared the order of paths from each PlanetLab node
in terms
of actual and predicted performance. For each node, we ranked all other
nodes in terms of TCP throughput, considering throughput to be
inversely proportional to latency and the square root of loss
rate [35]. These rankings were computed independently using
measured path properties and using iPlane's predictions for these
properties. Figure 4 plots the
correlation coefficient between the actual and iPlane predicted rankings
across all PlanetLab nodes. For ![]() of the nodes, the correlation
coefficient is greater than
of the nodes, the correlation
coefficient is greater than ![]() .
.
|
iPlane's measurements change over time with changes in the routes in the Internet and the traffic they carry. We again use PlanetLab data to estimate whether it suffices for iPlane to update its map every 6 hours. We are currently in the process of evaluating the stationarity of path properties for non-PlanetLab destinations as well.
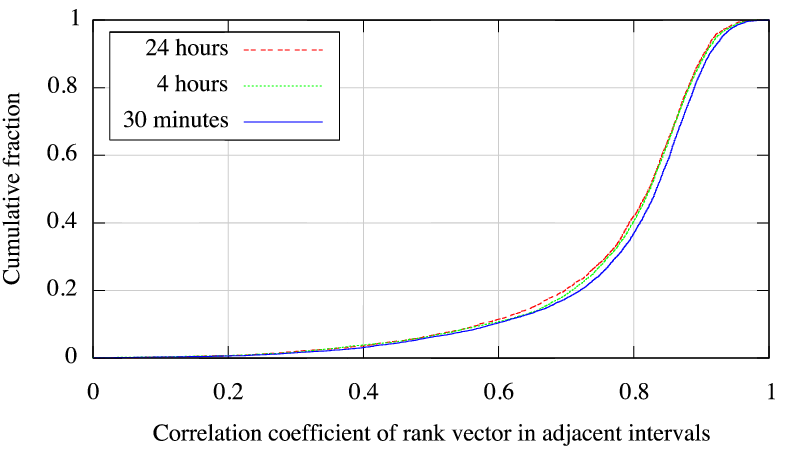
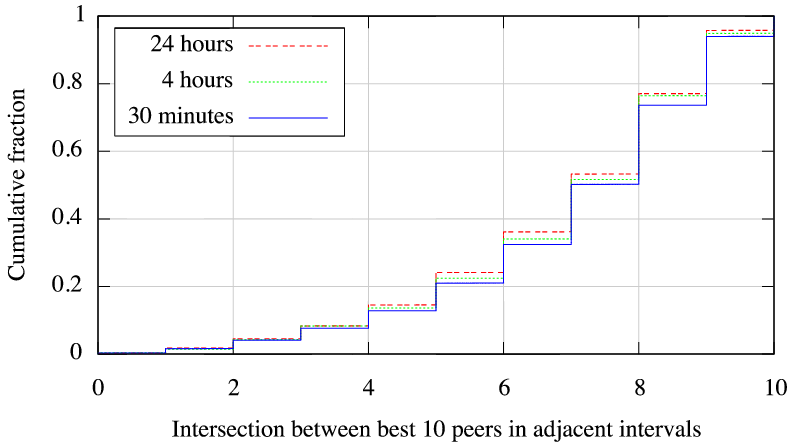
Over a period of 2 days, we measured the latency and loss rate between PlanetLab nodes once every 30 minutes. For this study, we used a dataset of 174 PlanetLab sites spanning 29 countries. In every interval, we computed for each node the ranking of all other nodes in terms of TCP throughput. To evaluate the flux in path properties over a 30 minute timescale, we compared these rankings between adjacent 30 minute intervals. For each PlanetLab node, we computed the correlation coefficient between the ranking vectors from adjacent intervals as well as computed the intersection between the top 10 nodes in these ranking vectors. To compare this with the flux in measurements over longer timescales, we also performed these computations across intervals 1 hour, 2 hours, 4 hours, 8 hours, 16 hours and 24 hours apart.
Figure 5(a) shows that the median correlation coefficient
between the rankings is greater than ![]() across all intervals from 30
minutes to a day.
Similarly, Figure 5(b) shows that in the median case, 7
of the top 10 nodes in this ranking are identical on timescales from 30
minutes to a day. Though these results are only for paths between
PlanetLab nodes, they seem to indicate that there is little value
in updating the map more frequently than once every few hours, compared to
once every 30 minutes.
across all intervals from 30
minutes to a day.
Similarly, Figure 5(b) shows that in the median case, 7
of the top 10 nodes in this ranking are identical on timescales from 30
minutes to a day. Though these results are only for paths between
PlanetLab nodes, they seem to indicate that there is little value
in updating the map more frequently than once every few hours, compared to
once every 30 minutes.
To measure the edges of the Internet, we deployed a modified
BitTorrent client on ![]() PlanetLab nodes. As described in
Section 2.4, our infrastructure for measuring the edge
involves the millions of users who frequently participate in the
BitTorrent filesharing application.
Every hour, we crawl well-known public websites that provide links to
several thousand .torrent files to put together a list of
PlanetLab nodes. As described in
Section 2.4, our infrastructure for measuring the edge
involves the millions of users who frequently participate in the
BitTorrent filesharing application.
Every hour, we crawl well-known public websites that provide links to
several thousand .torrent files to put together a list of
![]() popular swarms. The number of swarms for consideration was
chosen so as to ensure the participation of several of our measurement
vantage points in each swarm. The number of PlanetLab nodes designated
to a swarm is proportional to the number of peers participating in it.
popular swarms. The number of swarms for consideration was
chosen so as to ensure the participation of several of our measurement
vantage points in each swarm. The number of PlanetLab nodes designated
to a swarm is proportional to the number of peers participating in it.
Each PlanetLab node runs a BitTorrent client that we have modified in
several ways to aid in our measurements. First, the modified client
does not upload any data nor does it write any data that it downloads onto
disk.
Second, our client severs connections once we have exchanged ![]() MB of
data, which suffices for purposes of our measurements. Finally, we
introduce a shadow tracker--a database that coordinates
measurements among all PlanetLab nodes participating in a single
swarm. Instead of operating only on the set of peers returned by the
original tracker for the swarm, our modified client also makes use of
the set of peers returned to any measurement node.
Clients preferentially attempt to connect and download data from peers
that have not yet been measured by a sufficient number of
vantage points. These modifications are crucial for measurement
efficiency and diversity since typical BitTorrent trackers permit
requesting only a restricted set (
MB of
data, which suffices for purposes of our measurements. Finally, we
introduce a shadow tracker--a database that coordinates
measurements among all PlanetLab nodes participating in a single
swarm. Instead of operating only on the set of peers returned by the
original tracker for the swarm, our modified client also makes use of
the set of peers returned to any measurement node.
Clients preferentially attempt to connect and download data from peers
that have not yet been measured by a sufficient number of
vantage points. These modifications are crucial for measurement
efficiency and diversity since typical BitTorrent trackers permit
requesting only a restricted set (![]() -
-![]() ) of participating peers
once every
) of participating peers
once every ![]() minutes or more. Such short lists are quickly exhausted
by our modified client.
minutes or more. Such short lists are quickly exhausted
by our modified client.
During a ![]() hour period, our
measurement nodes connected to 301,595 distinct IP addresses, and
downloaded sufficient data to measure the upload bandwidth capacity
from 70,428.
These hosts span 3591 distinct ASes, 19,639 distinct BGP prefixes,
and 160 different countries.
hour period, our
measurement nodes connected to 301,595 distinct IP addresses, and
downloaded sufficient data to measure the upload bandwidth capacity
from 70,428.
These hosts span 3591 distinct ASes, 19,639 distinct BGP prefixes,
and 160 different countries.
 |
Our edge bandwidth capacity measurement relies on inter-arrival times
observed between data packets in the connections we maintain with
BitTorrent peers. We implemented the multiQ [27] technique
to infer end-to-end bottleneck bandwidth capacity from these
inter-arrival times. Although the accuracy of multiQ presented in
previous studies is encouraging, the unique
properties of PlanetLab motivated us to provide further
validation. To verify that multiQ yields reasonable data with short
TCP traces in the presence of cross traffic on machines under heavy load,
we compared our measurements with those made by ![]() [13].
[13].
We setup a test torrent and had our measurement clients running on
![]() PlanetLab nodes participate in this torrent. From this setup, we
opportunistically measured the bottleneck bandwidth capacities between
these PlanetLab nodes.
The dataset we gathered from this experiment had 10,879 paths in
common with measurements made by
PlanetLab nodes participate in this torrent. From this setup, we
opportunistically measured the bottleneck bandwidth capacities between
these PlanetLab nodes.
The dataset we gathered from this experiment had 10,879 paths in
common with measurements made by ![]() on the same day.
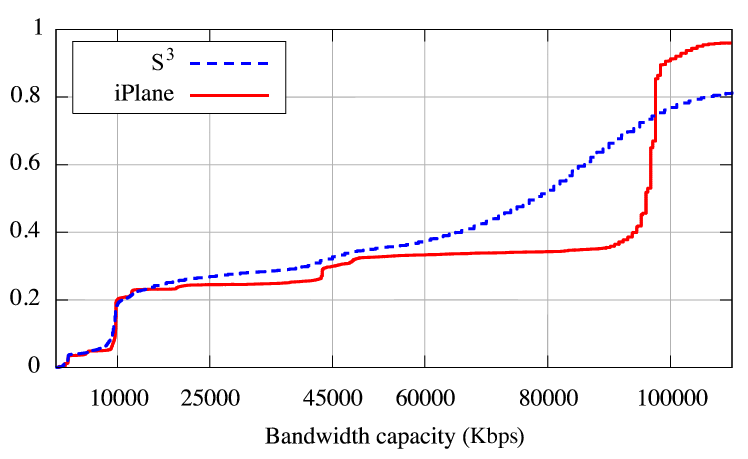
Figure 6 compares the bandwidth capacities
measured by the two methods. The measurements made by iPlane closely match those of
on the same day.
Figure 6 compares the bandwidth capacities
measured by the two methods. The measurements made by iPlane closely match those of ![]() for capacities less than
for capacities less than ![]() Mbps. At
higher bandwidth capacities, they are only roughly correlated. We
attribute this difference to the use of user-level timestamps by
Mbps. At
higher bandwidth capacities, they are only roughly correlated. We
attribute this difference to the use of user-level timestamps by
![]() . As
inter-packet spacing can be rather small for high capacity paths,
user-level timestamps are likely to be inaccurate in the highly loaded
PlanetLab environment. Our measurement setup makes use of kernel-level
timestamps and is therefore less sensitive to high CPU load.
For typical access link bandwidths, the two tools produce similar data;
the value of using BitTorrent is that it works with unmodified clients
that sit behind firewalls or NATs that would drop active measurement
probes.
The more discernible steps in the iPlane line in
Figure 6 are at 10Mbps, 45Mbps (T3), and 100Mbps,
which correspond to typical ISP bandwidth classes.
. As
inter-packet spacing can be rather small for high capacity paths,
user-level timestamps are likely to be inaccurate in the highly loaded
PlanetLab environment. Our measurement setup makes use of kernel-level
timestamps and is therefore less sensitive to high CPU load.
For typical access link bandwidths, the two tools produce similar data;
the value of using BitTorrent is that it works with unmodified clients
that sit behind firewalls or NATs that would drop active measurement
probes.
The more discernible steps in the iPlane line in
Figure 6 are at 10Mbps, 45Mbps (T3), and 100Mbps,
which correspond to typical ISP bandwidth classes.
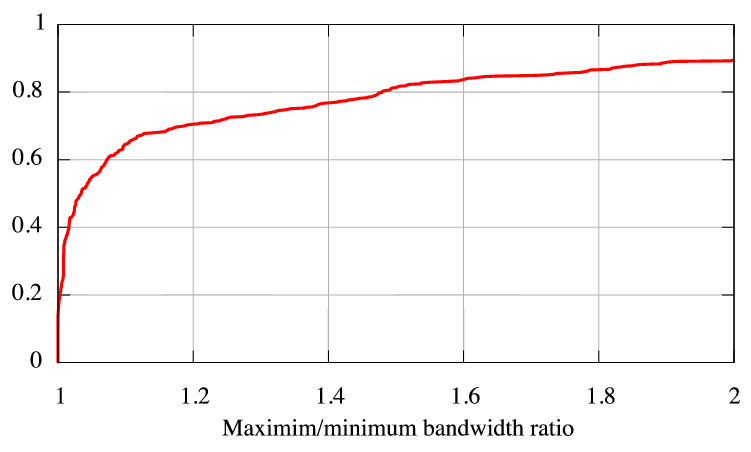 |
Although the data produced by our opportunistic strategy is extensive,
it is by no means complete.
Not every client participates in popular torrents.
In Figure 7, we explore the validity
of using BitTorrent measurements to predict the performance
of other clients in the same prefix.
For every ![]() prefix in which we have
measurements to multiple end-hosts from the same vantage point, we
compute the ratio of the
maximum to the minimum measured bandwidth capacity. For
prefix in which we have
measurements to multiple end-hosts from the same vantage point, we
compute the ratio of the
maximum to the minimum measured bandwidth capacity. For ![]() of
of
![]() prefixes, the capacities measured differ by less than
prefixes, the capacities measured differ by less than ![]() .
.
In this section, we show how applications can benefit from using iPlane. We evaluate three distributed services for potential performance benefits from using iPlane.
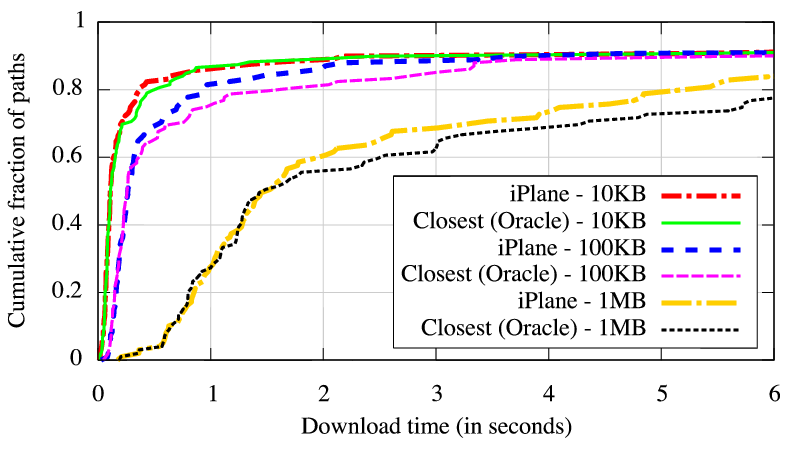 |
Content distribution networks (CDNs) such as Akamai, CoDeeN and Coral [1,52,16] redirect clients to a nearby replica. The underlying assumption is that distance determines network performance. However, there is more to network performance than just distance, or round trip time. TCP throughput, for example, depends on both distance and loss rate [35,5]. Even for small web documents, loss of a SYN or a packet during slow start can markedly inflate transfer time. A CDN using iPlane can track the RTT, loss rate, and bottleneck capacity from each replica to the rest of the Internet. The CDN can then arrange for its name servers to redirect the client to optimize using the model of its choice.
We emulate a small CDN comprising 30 randomly chosen PlanetLab nodes. Each node serves 3 files of sizes 10KB, 100KB and 1MB. We use 141 other PlanetLab nodes to emulate clients. Each client downloads all 3 files from the replica that provides the best TCP throughput as predicted by the PFTK model [35] using iPlane's estimates of RTT and loss rate, and from the replica closest in terms of actual measured RTT. Note that this comparison is against an optimum that cannot be achieved without extensive probing. A real CDN will only have estimated RTTs available. Figure 8 compares the download times experienced by the clients in either case, excluding the latency of redirecting to the replica. Choosing the replica for optimized TCP throughput based on iPlane's predictions provides slightly better performance than choosing the closest replica. Though these results are only indicative, they suggest that iPlane with its ability to provide multi-attribute network performance data will be more effective than systems such as OASIS [17] that simply optimize for RTT.
 |
We next show how iPlane can enable informed peer selection in popular
swarming systems like BitTorrent. In current implementations, a
centralized BitTorrent tracker serves each client a random list
of peers. Each client enforces a tit-for-tat bandwidth reciprocity
mechanism that incents users to contribute more upload bandwidth to
obtain faster downloads. However, the same mechanism also serves to
optimize path selection at a local level--peers simply try uploading
to many random peers and eventually settle on a set that maximizes
their download rate. Because reasoning about peer quality occurs
locally at each client, each client needs to keep a large pool of
directly connected peers (![]() -
-![]() for typical swarms)
even though at any time only a few of these
(
for typical swarms)
even though at any time only a few of these
(![]() -
-![]() ) are actively engaged in data transfer with the client.
This overhead and consequent delayed convergence
is fundamental: with only local information, peers
cannot reason about the value of neighbors without actively exchanging
data with them.
iPlane's predictions can overcome the lack of prior information regarding
peer performance and can thus enable a clean
separation of the path selection policy from the incentive mechanism.
) are actively engaged in data transfer with the client.
This overhead and consequent delayed convergence
is fundamental: with only local information, peers
cannot reason about the value of neighbors without actively exchanging
data with them.
iPlane's predictions can overcome the lack of prior information regarding
peer performance and can thus enable a clean
separation of the path selection policy from the incentive mechanism.
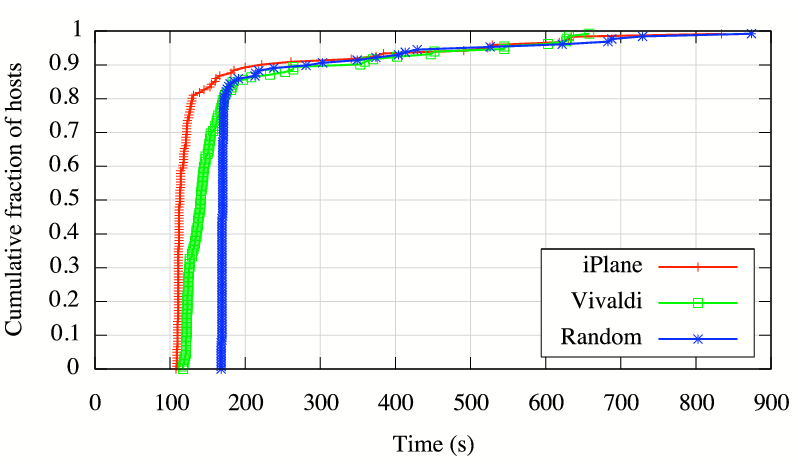
We built a modified tracker that uses iPlane for informed peer selection. Instead of returning random peers, the tracker uses the iPlane's loss rate and latency estimates to infer TCP throughput. It then returns a set of peers, half of which have high predicted throughput and the rest randomly selected. The random subset is included to prevent the overlay from becoming disconnected (e.g., no US node preferring a peer in Asia).
We used our modified tracker to coordinate the distribution of a ![]() megabyte file over
megabyte file over ![]() PlanetLab nodes.
We measured the time taken by each of the peers to
download the file after the seed was started.
Figure 9 compares the download times
observed with iPlane predictions against those of peerings induced
by Vivaldi coordinates [11] and an unmodified tracker. Informed peer
selection causes roughly
PlanetLab nodes.
We measured the time taken by each of the peers to
download the file after the seed was started.
Figure 9 compares the download times
observed with iPlane predictions against those of peerings induced
by Vivaldi coordinates [11] and an unmodified tracker. Informed peer
selection causes roughly ![]() of peers to have significantly lower download
times.
of peers to have significantly lower download
times.
Although preliminary, these performance numbers
are encouraging. We believe that better use of information from the
iPlane can lead to even further improvements in performance. Our
selection of ![]() as the fraction of random peers was arbitrary, and
we are currently investigating the tradeoff between robustness and
performance, as well as the degree to which these results extend to swarms
with a more typical distribution of bandwidths.
as the fraction of random peers was arbitrary, and
we are currently investigating the tradeoff between robustness and
performance, as well as the degree to which these results extend to swarms
with a more typical distribution of bandwidths.
|
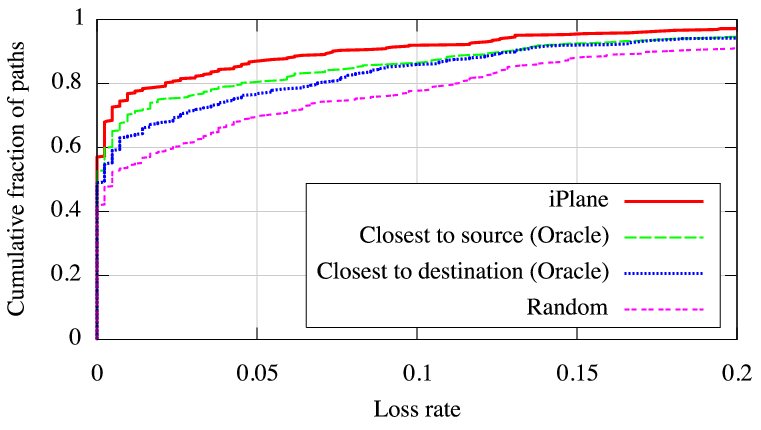
Voice over IP (VoIP) is a rapidly growing application that requires paths with low latency, loss and jitter for good performance. Several VoIP implementations such as Skype [45] require relay nodes to connect end-hosts behind NATs/firewalls. Choosing the right relay node is crucial to providing acceptable user-perceived performance [39]. Reducing end-to-end latency is important since humans are sensitive to delays above a threshold. Low loss rates improve sound quality and reduce throughput consumed by compensating codecs. Measures of user-perceived sound quality such as mean opinion score [51] have been shown to be highly correlated with loss rate and end-to-end delay. Thus, VoIP applications can benefit from iPlane's predictions of latency and loss rate in choosing the best possible relay node.
To evaluate iPlane's ability to successfully pick good relay
nodes, we emulated VoIP traffic patterns on PlanetLab. We considered
![]() pairs of PlanetLab nodes, chosen at random, as being
representative of end-hosts participating in a VoIP call. Between each
pair, we emulated a call by sending a
pairs of PlanetLab nodes, chosen at random, as being
representative of end-hosts participating in a VoIP call. Between each
pair, we emulated a call by sending a ![]() KBps UDP packet stream via
another PlanetLab node chosen as the relay node. We tried
KBps UDP packet stream via
another PlanetLab node chosen as the relay node. We tried ![]() different relay options for each pair chosen based on (i) the
iPlane's estimates of latency and loss rate, (ii) latency to the
source, (iii) latency to the destination, and (iv) random choice. The
iPlane-informed choice was obtained by first querying for the
different relay options for each pair chosen based on (i) the
iPlane's estimates of latency and loss rate, (ii) latency to the
source, (iii) latency to the destination, and (iv) random choice. The
iPlane-informed choice was obtained by first querying for the ![]() relay options that minimize end-to-end loss and then, choosing the
one that minimized end-to-end delay among these options.
relay options that minimize end-to-end loss and then, choosing the
one that minimized end-to-end delay among these options.
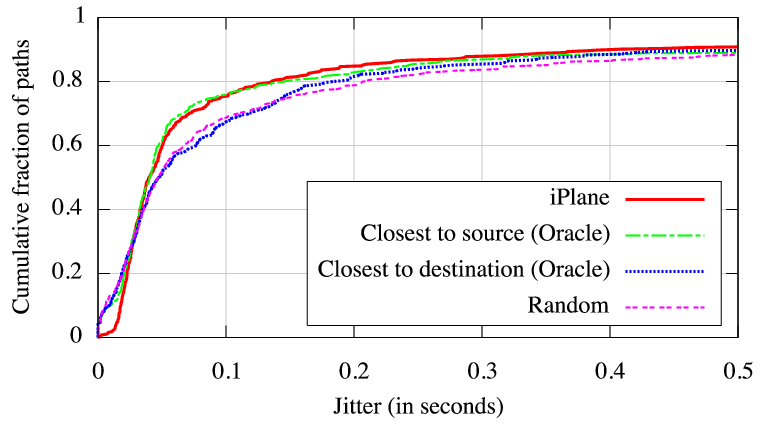
Each emulated call lasted for ![]() seconds, and the end-to-end loss
rate and latency were measured. Figure 10(a)
shows that significantly lower loss rates were observed along relay
paths chosen based on iPlane's predictions. Additionally,
Figure 10(b) shows that iPlane also
helps to reduce jitter, which we computed as the standard deviation of
end-to-end latency.
These results
demonstrate the potential for the use of iPlane in VoIP
applications.
seconds, and the end-to-end loss
rate and latency were measured. Figure 10(a)
shows that significantly lower loss rates were observed along relay
paths chosen based on iPlane's predictions. Additionally,
Figure 10(b) shows that iPlane also
helps to reduce jitter, which we computed as the standard deviation of
end-to-end latency.
These results
demonstrate the potential for the use of iPlane in VoIP
applications.
iPlane bridges and builds upon ideas from network measurement, performance modeling, Internet tomography, and recent efforts towards building a knowledge plane for the Internet. We believe that an Internet-scale instantiation of iPlane is greater than the sum of its parts, and relate individual contributions to prior work.
Information Plane Clark et al. [8] pioneered the broad vision of a knowledge plane to build large-scale, self-managing and self-diagnosing networks based on tools from AI and cognitive science. Several research efforts have since addressed pieces of this problem.
Several efforts have looked at monitoring end-host performance and in optimizing the query processing engine of the information plane. Examples include Sophia [53], PIER [23], and IrisNet [18]. The above systems have a different focus than ours. They manage information about nodes (e.g., PlanetLab nodes, routers in an ISP, or sensors) under control of the information plane. We target predictions of path performance at Internet-scale.
Link Metrics IDMaps [15] is an early example of a network information service that estimates the latency between an arbitrary pair of nodes using a small set of vantage points as landmarks. Subsequently, Ng and Zhang [34] discovered that Internet distances can be embedded on to a low-dimensional Euclidean space. Such embeddings can be used to predict latencies between a large number of nodes by measuring latencies from a small number of vantage points to these nodes--a methodology refined by several others [54,10,11,44]. A key limitation of these techniques is that they treat the Internet as a black box and are only predictive, i.e., they do not explain why, if at all, their predictions are correct. As a result, they have serious systematic deficiencies, e.g., a significant fraction of Internet paths are known to have detours [41], however, metric embeddings obey the triangle inequality and will predict no detours.
Our previous work on a structural technique [31] to predict Internet paths and latencies, and experiences reported by independent research groups with respect to latency prediction [17], available bandwidth estimation [22], and the practical utility of embedding techniques [30] echo the need for structural approaches to predict sophisticated path metrics.
Inference Techniques Chen et al. [7] proposed an algebraic approach to infer loss rates on paths between all pairs of nodes based on measured loss rates on a subset of the paths. Duffield et al. [14] proposed a multicast-based approach to infer link loss rates by observing loss correlations between receivers. Rocketfuel [47] estimates ISP topologies by performing traceroutes from a set of vantage points, while the Doubletree [12] system efficiently prunes redundant traceroutes. Our frontier (Section 2.3) algorithm to efficiently target specific links for measurement is similar in spirit.
Passive Measurements Padmanabhan et al. [36] and Seshan et al.[42] propose passive measurements at Web servers and end-hosts respectively to predict path metrics. PlanetSeer by Zhang et al. [55] is a failure monitoring system that uses passive measurements at CDN caches under their control to diagnose path failures postmortem. Jaiswal et al. [26] propose a ``measurements-in-the-middle'' technique to infer end-to-end path properties using passive measurements conducted at a router. In contrast to these systems that perform passive measurements of existing connections, we participate in BitTorrent swarms and opportunistically create connections to existing peers for the explicit purpose of observing network behavior. Previously, opportunistic measurements have relied on spurious traffic in the Internet [6]. iPlane could also validate and incorporate measurement data from passive measurement sources, such as widely deployed CDNs, and such integration is part of future work.
The performance and robustness of overlay services critically depends on the choice of end-to-end paths used as overlay links. Today, overlay services face a tension between minimizing redundant probe overhead and selecting good overlay links. More importantly, they lack an accurate methods to infer path properties between an arbitrary pair of end-hosts. In this paper, we showed that it is possible to accurately infer sophisticated path properties between an arbitrary pair of nodes using a small number of vantage points and existing infrastructure. The key insight is to systematically exploit the Internet's structural properties. Based on this observation, we built the iPlane service and showed that it is feasible to infer a richly annotated link-level map of the Internet's routing topology once every few hours. Our case studies suggest that iPlane can serve as a common information plane for a wide range of distributed services such as content distribution, file swarming, and VoIP.
We would like to thank Jay Lepreau, Ratul Mahajan, KyoungSoo Park, Rob Ricci, Neil Spring and the anonymous OSDI reviewers for their valuable feedback on earlier versions of this paper. We also thank Peter Druschel for serving as our shepherd. This research was partially supported by the National Science Foundation under Grants CNS-0435065 and CNS-0519696.
This document was generated using the LaTeX2HTML translator Version 2002-2-1 (1.71)
Copyright © 1993, 1994, 1995, 1996,
Nikos Drakos,
Computer Based Learning Unit, University of Leeds.
Copyright © 1997, 1998, 1999,
Ross Moore,
Mathematics Department, Macquarie University, Sydney.
The command line arguments were:
latex2html -split 0 -show_section_numbers -local_icons iplane.tex
The translation was initiated by Harsha Madhyastha on 2006-09-06